Inventory forecasting: seasonality, order cycles, supplier closures and a stock run-down
A forecast built on the last 30 days of sales doesn't know that December sells twice as fast as October, that you only order every six weeks, or that your factory closes for a month in February. So the order before the holidays runs short, and the order before Chinese New Year lands after you've sold out. Demand Planning now plans for all three. It can follow last year's seasons automatically, size each order to last until your next order lands, and plan around supplier closures and inbound cutoffs. A new stock run-down shows each product's stock month by month, so you can see who runs out and when.
Everything is off until you turn it on, so your existing forecasts, saved configurations and schedules don't change. The one exception is the Inventory Planning report's lead time, described at the end.
✨ What this means for you:
- Orders before a busy season are big enough, and orders before a quiet one aren't too big, without entering monthly percentages by hand.
- Each order lasts until the next one lands, and the results tell you the date it covers through.
- Orders that cross Chinese New Year or another shutdown get the extra lead time and cover the closure, with the last day to order on every line.
- You can see month by month which products run out before your next order, and why.
Follow last year's seasons
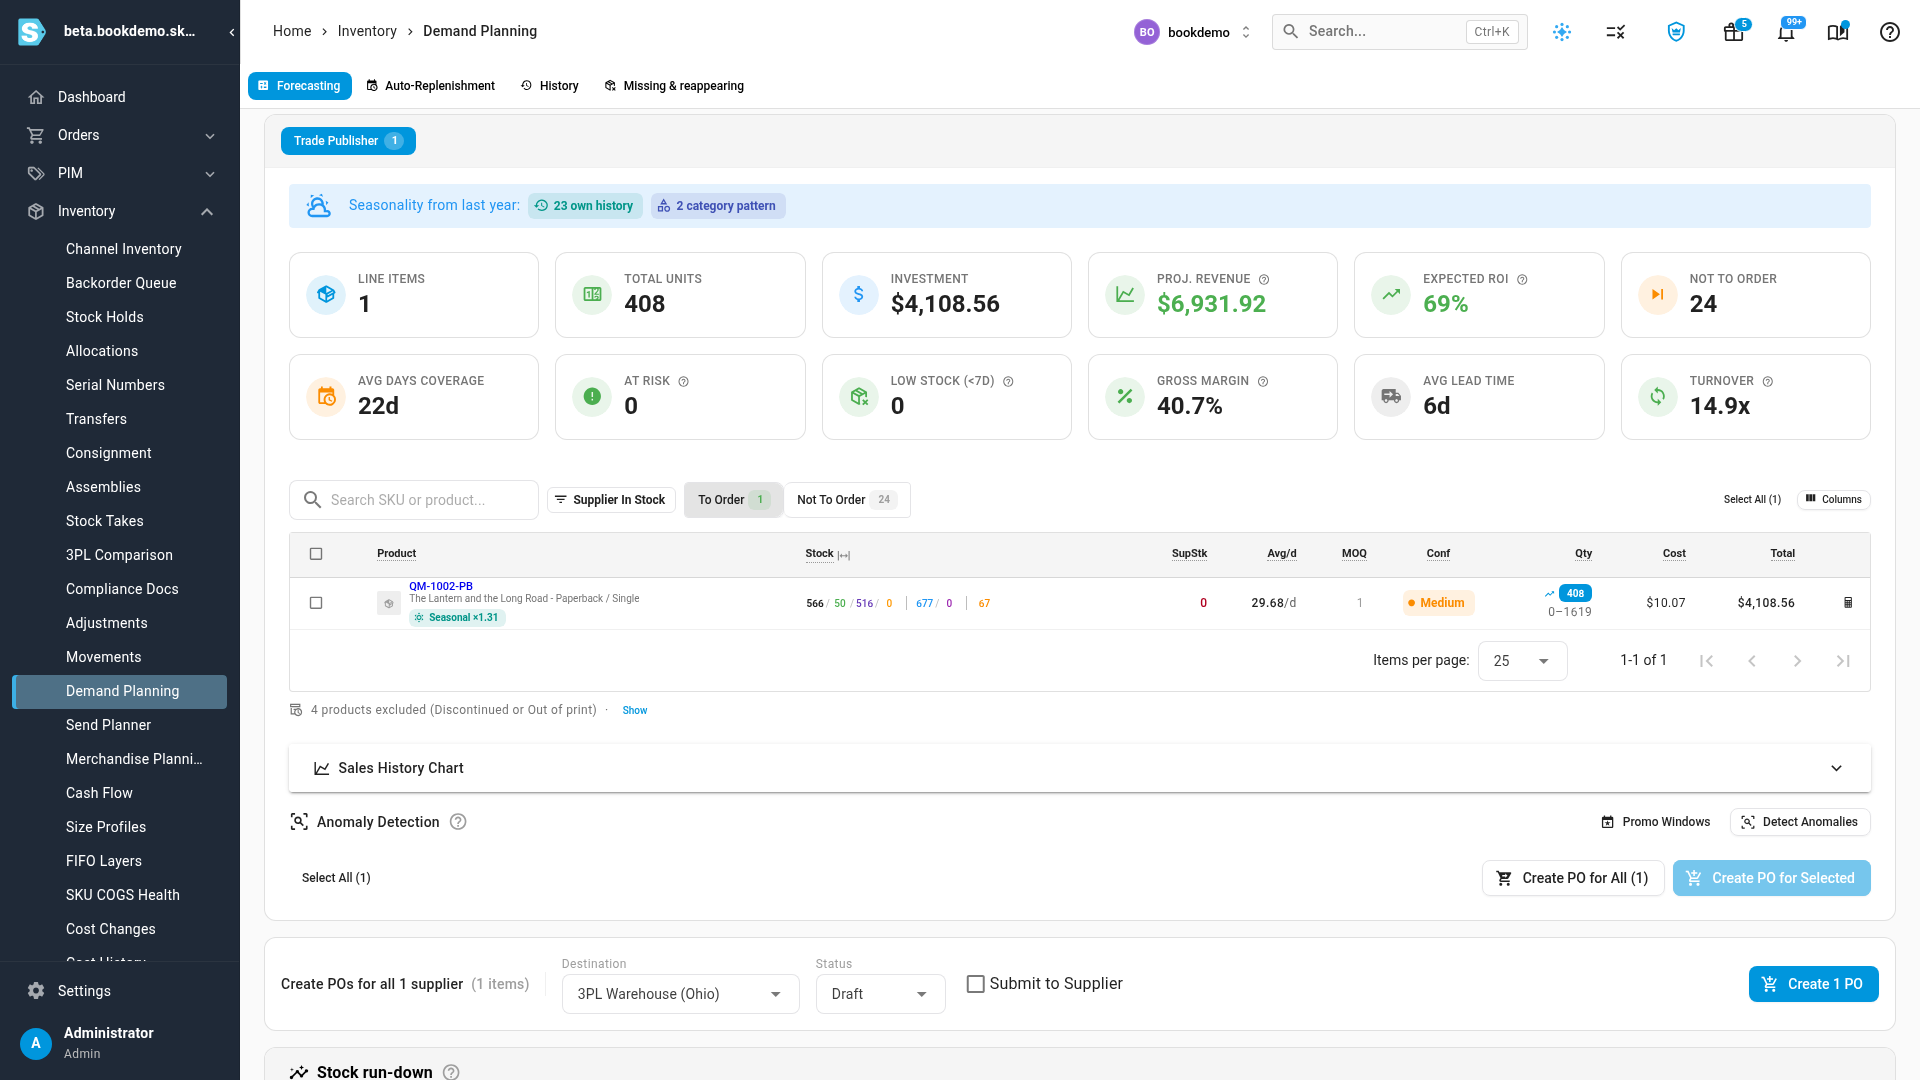
Set Seasonality to Automatic from last year on a Sales Based forecast. For each product with about a year of sales, SKU.io compares how last year's sales ran across the days this order covers with how they ran across your sales history window, and lifts or lowers the daily average to match. Your recent sales still set the level. Last year only sets the shape.
Products with less history use their category's pattern, then any seasonal adjustments you entered, so nothing is counted twice. Out-of-stock days and past promotions are left out of last year's figures, so a stockout doesn't look like a quiet month. A banner counts which source each product used, every line shows its factor, such as Seasonal ×1.31, and Calculation Details shows last year's months and the arithmetic.
Size orders to your order cycle
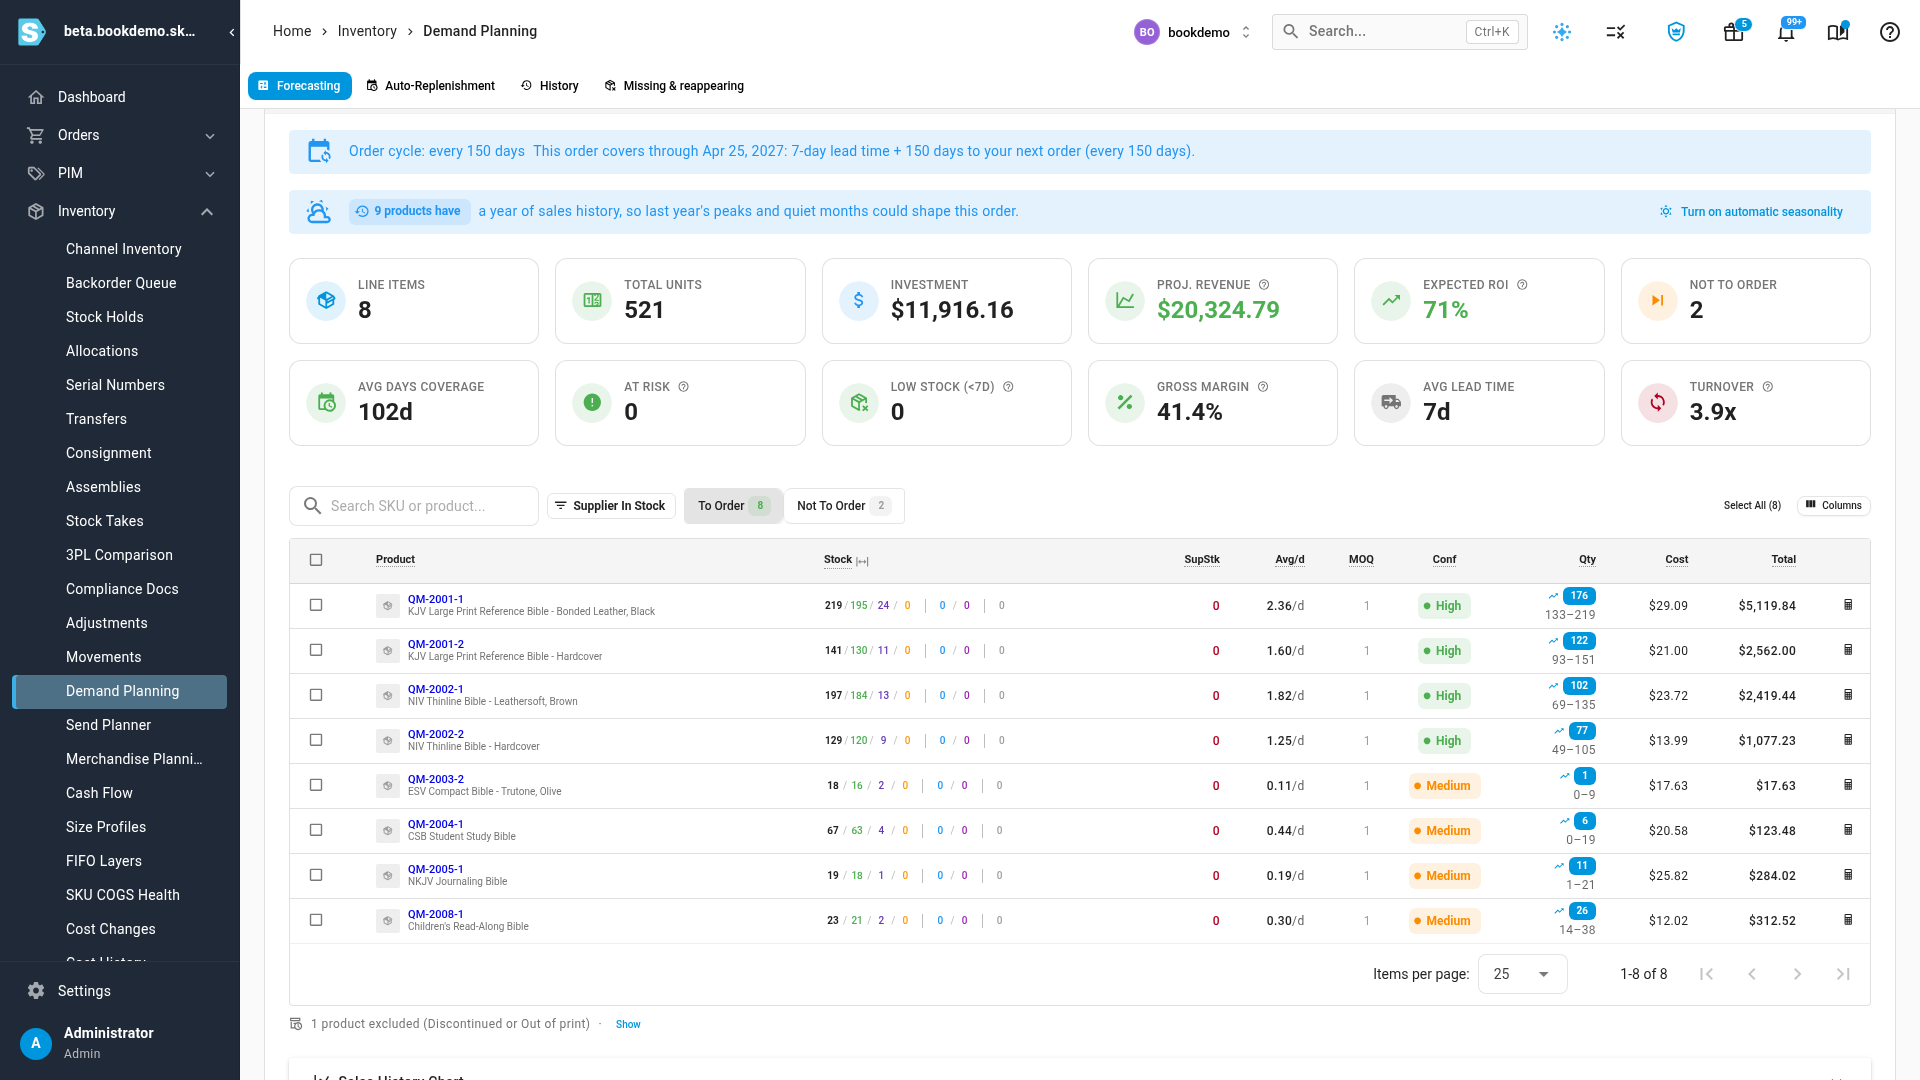
Under Plan cover by, choose Order cycle instead of Target stock days. Enter how often you order, or the date of your next order, and every line is sized to cover the lead time plus the days until the next order. The results say exactly how far it reaches, for example This order covers through Apr 25, 2027: 7-day lead time + 150 days to your next order. A repeating cycle can go on an Auto-Replenishment schedule.
Plan around supplier closures and inbound cutoffs
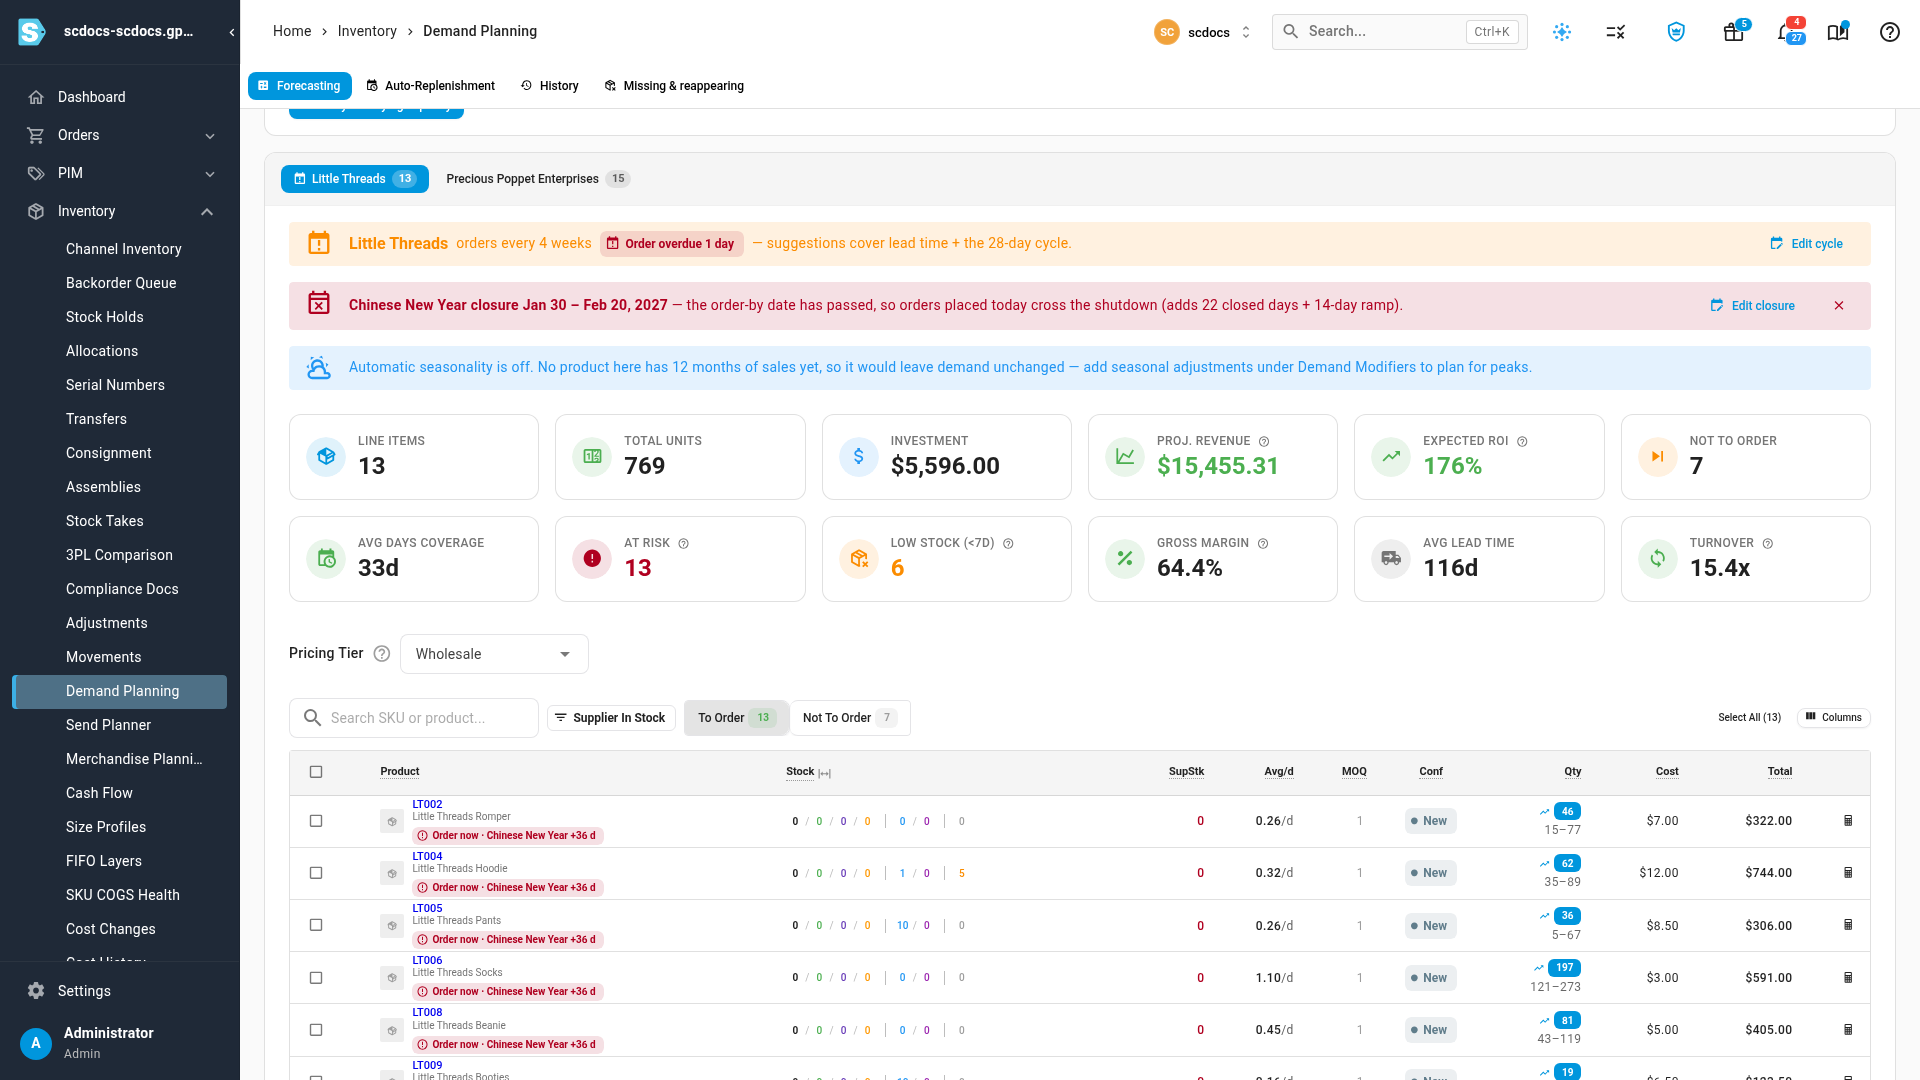
Under Settings → Purchasing → Supplier Closures, add a factory shutdown with a preset for Chinese New Year, Vietnam Tết or Golden Week, or a warehouse inbound cutoff such as Amazon's Q4 restrictions. You set the dates once.
An order that runs into a closure then gets the closed days and the recovery ramp added to its lead time, and is sized to last through the shutdown. Demand Planning shows a banner with the last day to order, each line gets an Order by chip or Order now, and Calculation Details breaks down every added day. The Inventory Planning report gains an Order By column and a +N chip on the lead time, and your schedules warn you before an order-by date, even on a day when nothing needs ordering.
See stock run down, month by month
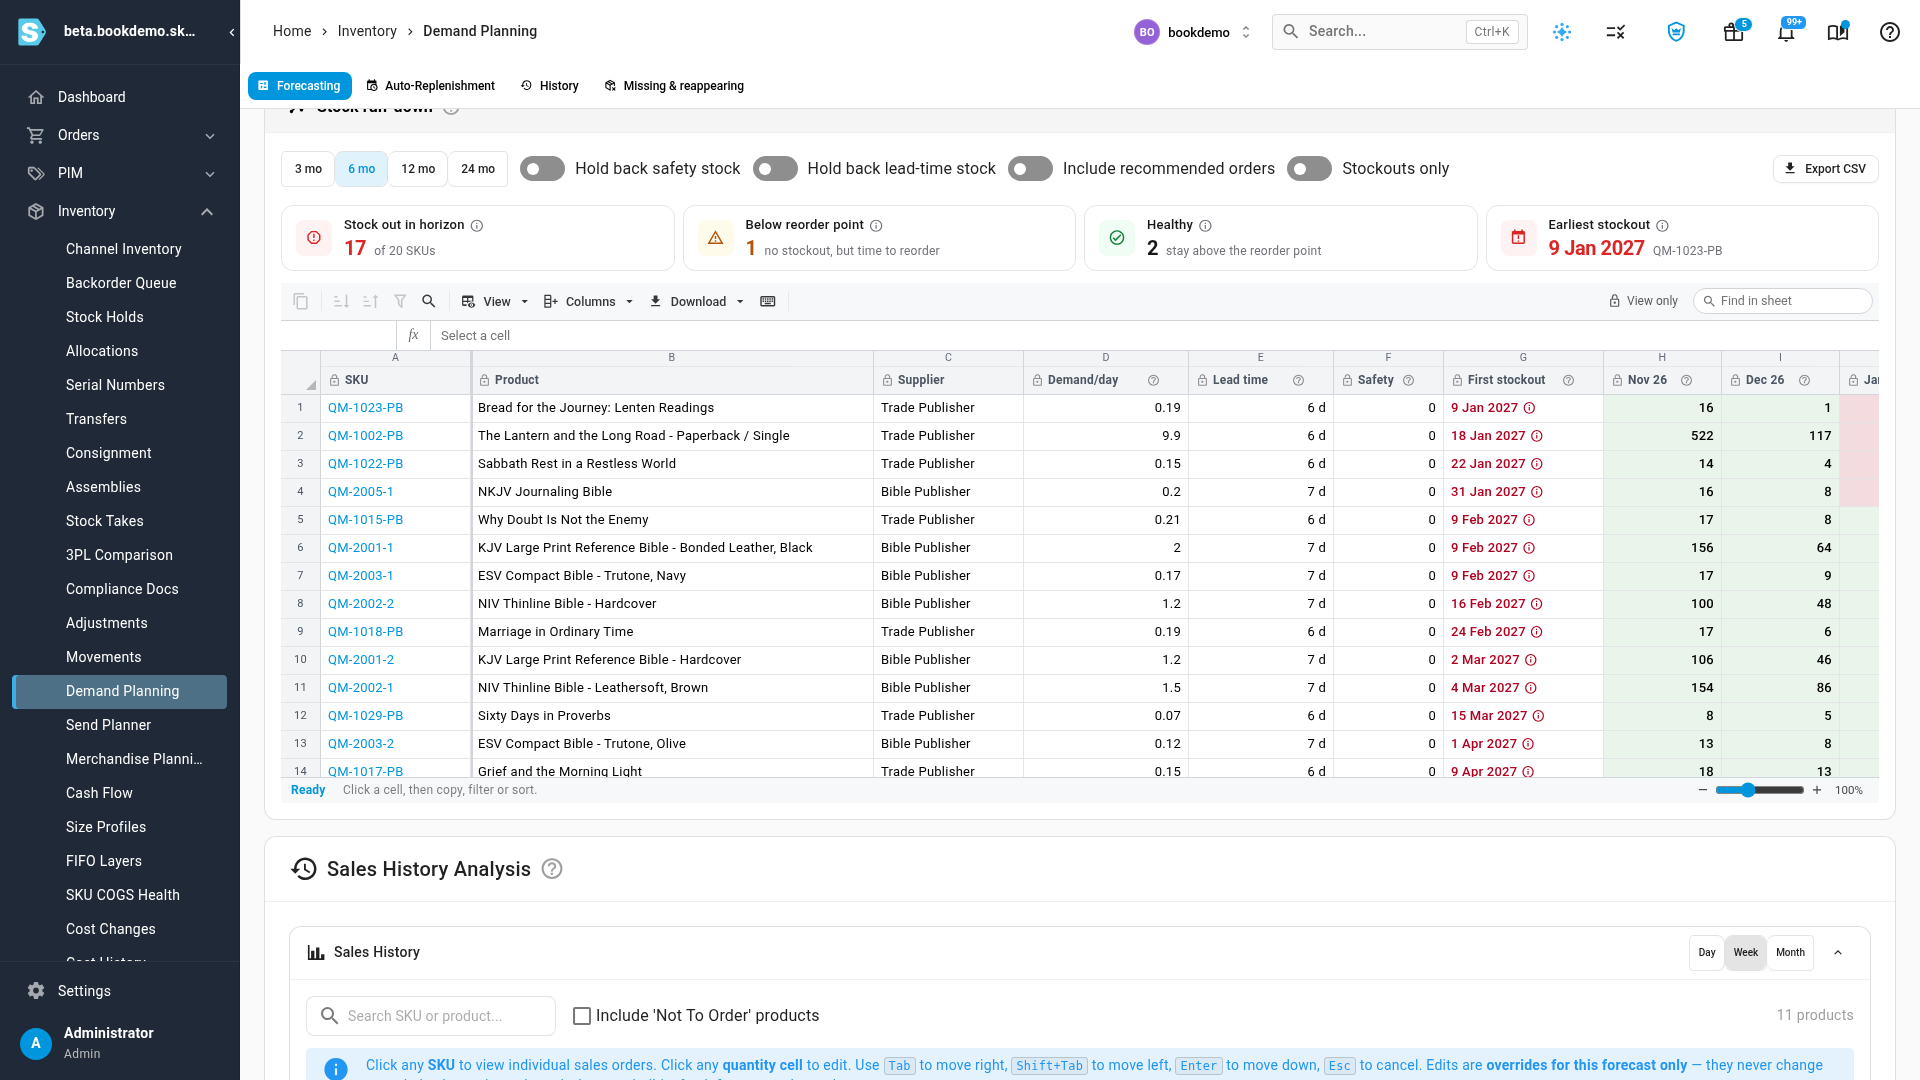
Below the forecast results, the Stock run-down card projects every product's ending stock for 3 to 24 months. Months are red where the product runs out and amber where it drops below its reorder point, with the purchase orders and transfers already on the way. Click a product's first stockout date to see why: the inputs, the arrivals, any order that lands too late, and the month-by-month sums. Every product page has the same view under Stock Run-down, and the Inventory Planning report links to it from each SKU.
Also new: approve a batch of purchase orders together
When a forecast, a schedule run or an import creates several purchase orders at once, an approval tier can now look at their combined total with Also applies to batches over. Approvers see the whole batch in one panel and can approve or reject it in one action. See Approve a batch of purchase orders.
One change to existing numbers
The Inventory Planning report now uses the same lead time as Demand Planning: the product's lead time on its supplier, then the supplier's own lead time, then your account's default, with the measured lead time from recent purchase orders taking over when it's longer. Two things follow:
- Products that relied on the supplier's or the account's lead time used to show Set lead time and no suggestion. They now show a lead time, a stockout risk and a suggested quantity.
- Create PO sizes quantities with that same lead time. Where your suppliers deliver slower than quoted, the suggested quantities are larger than before.
Where to find it
- Seasonality and Plan cover by: Inventory → Demand Planning, in Configuration, with Sales Based selected.
- Supplier closures: Settings → Purchasing → Supplier Closures, or a supplier's Settings → Purchasing Defaults → Closures.
- Stock run-down: below the results on Inventory → Demand Planning, or on a product page under Stock → Stock Run-down.
- Full guides: Forecast with automatic seasonality from last year, Plan cover by order cycle, Set up supplier closures and inbound cutoffs and Read the stock run-down grid.