Read the stock run-down grid
A reorder quantity tells you what to buy today. The stock run-down shows what happens next: each product's projected ending stock for every month ahead, coloured by whether it runs out, drops below its reorder point or stays healthy. Use it to spot the products that stock out before your next order lands, and to check that the purchase orders already on the way arrive in time.
The run-down is read-only. It never changes a forecast or an order.
Before you begin
- The run-down projects from a forecast, so the products need what a forecast needs: sales history and a supplier with a Lead Time. See Forecast demand and replenish stock.
- Give purchase orders an expected delivery date. An open purchase order with no date, or one past its date, is counted as arriving today, which makes the run-down look healthier than it is.
Open the run-down
You can open it from three places:
- Demand Planning: go to Inventory → Demand Planning, build a forecast, and scroll to the Stock run-down card below the results. It shows every product the forecast plans to order, across all the suppliers you picked.
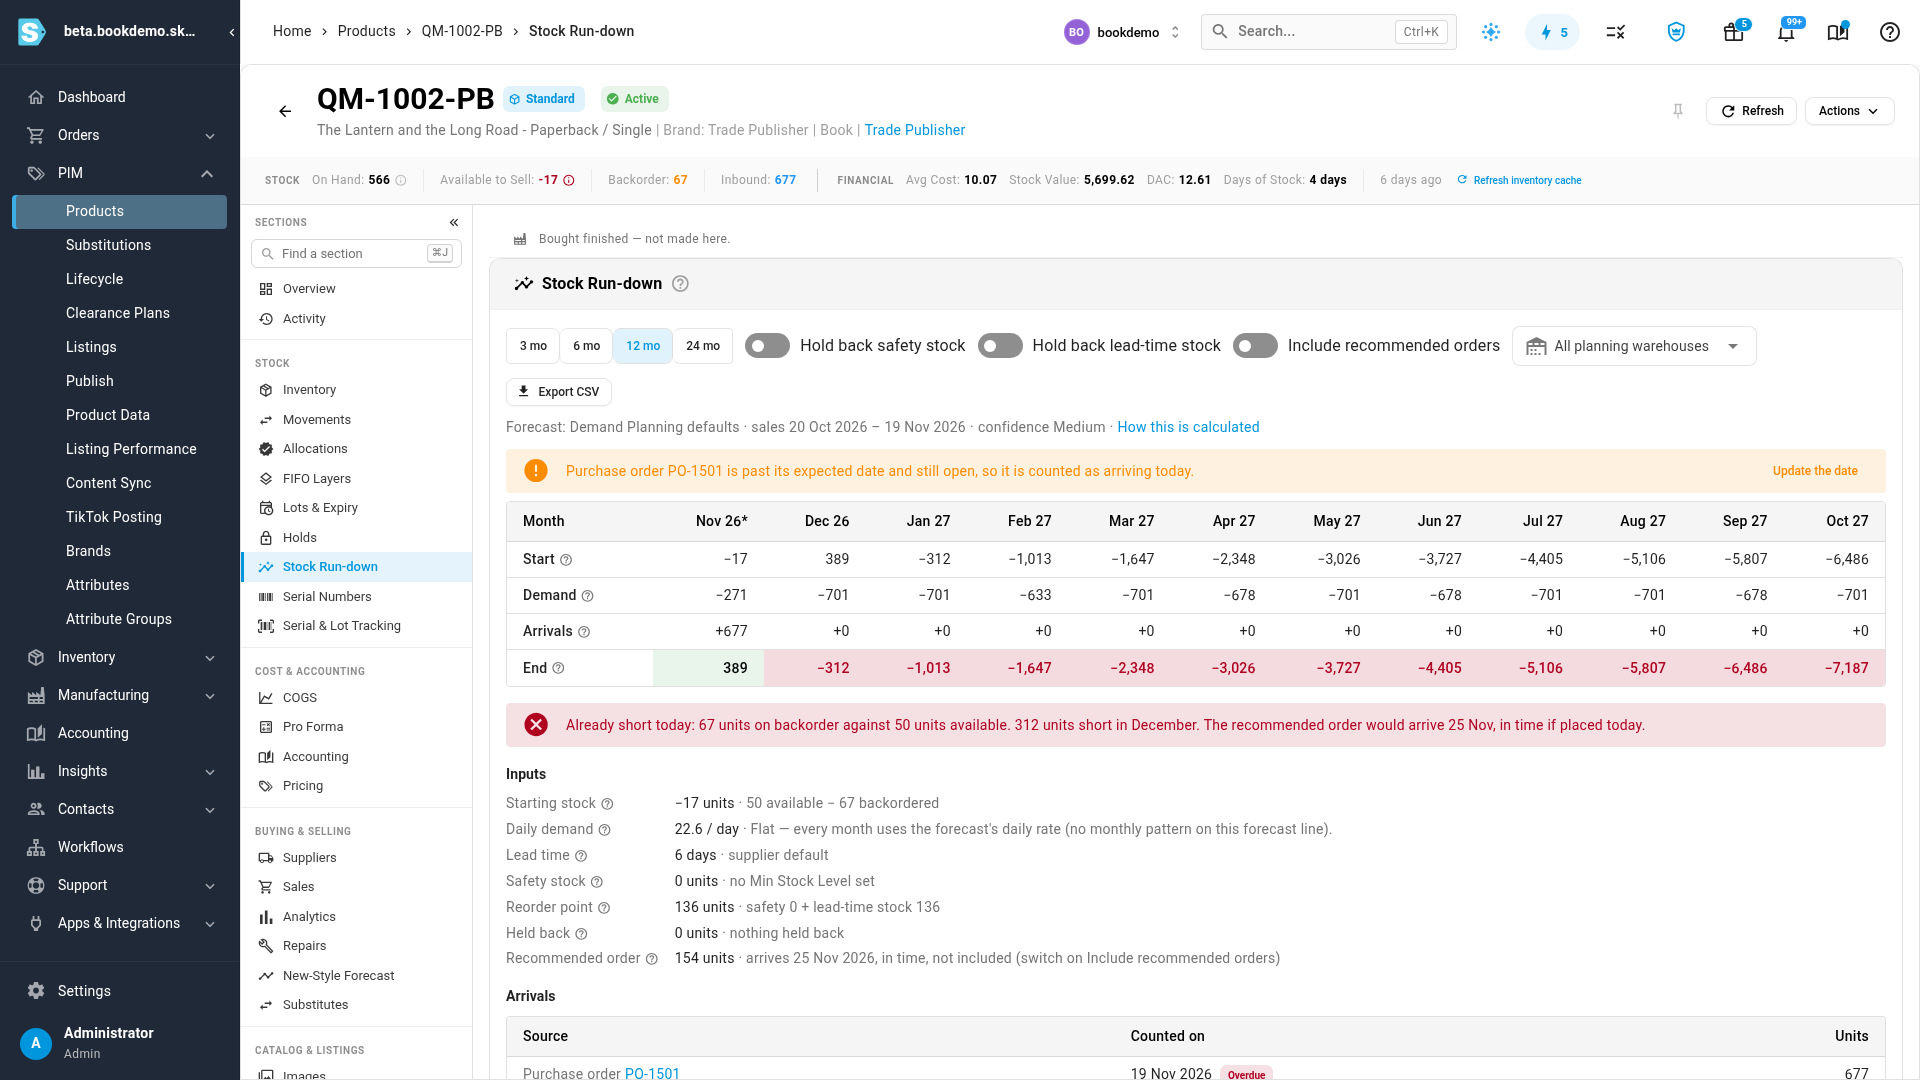
- A product page: open the product and, under Sections → Stock, click Stock Run-down. It shows that one product.
- Inventory Planning report: go to Insights → Reports → Inventory Planning and click the chart icon beside a SKU. The product's run-down opens in a new tab.
Read the grid
-
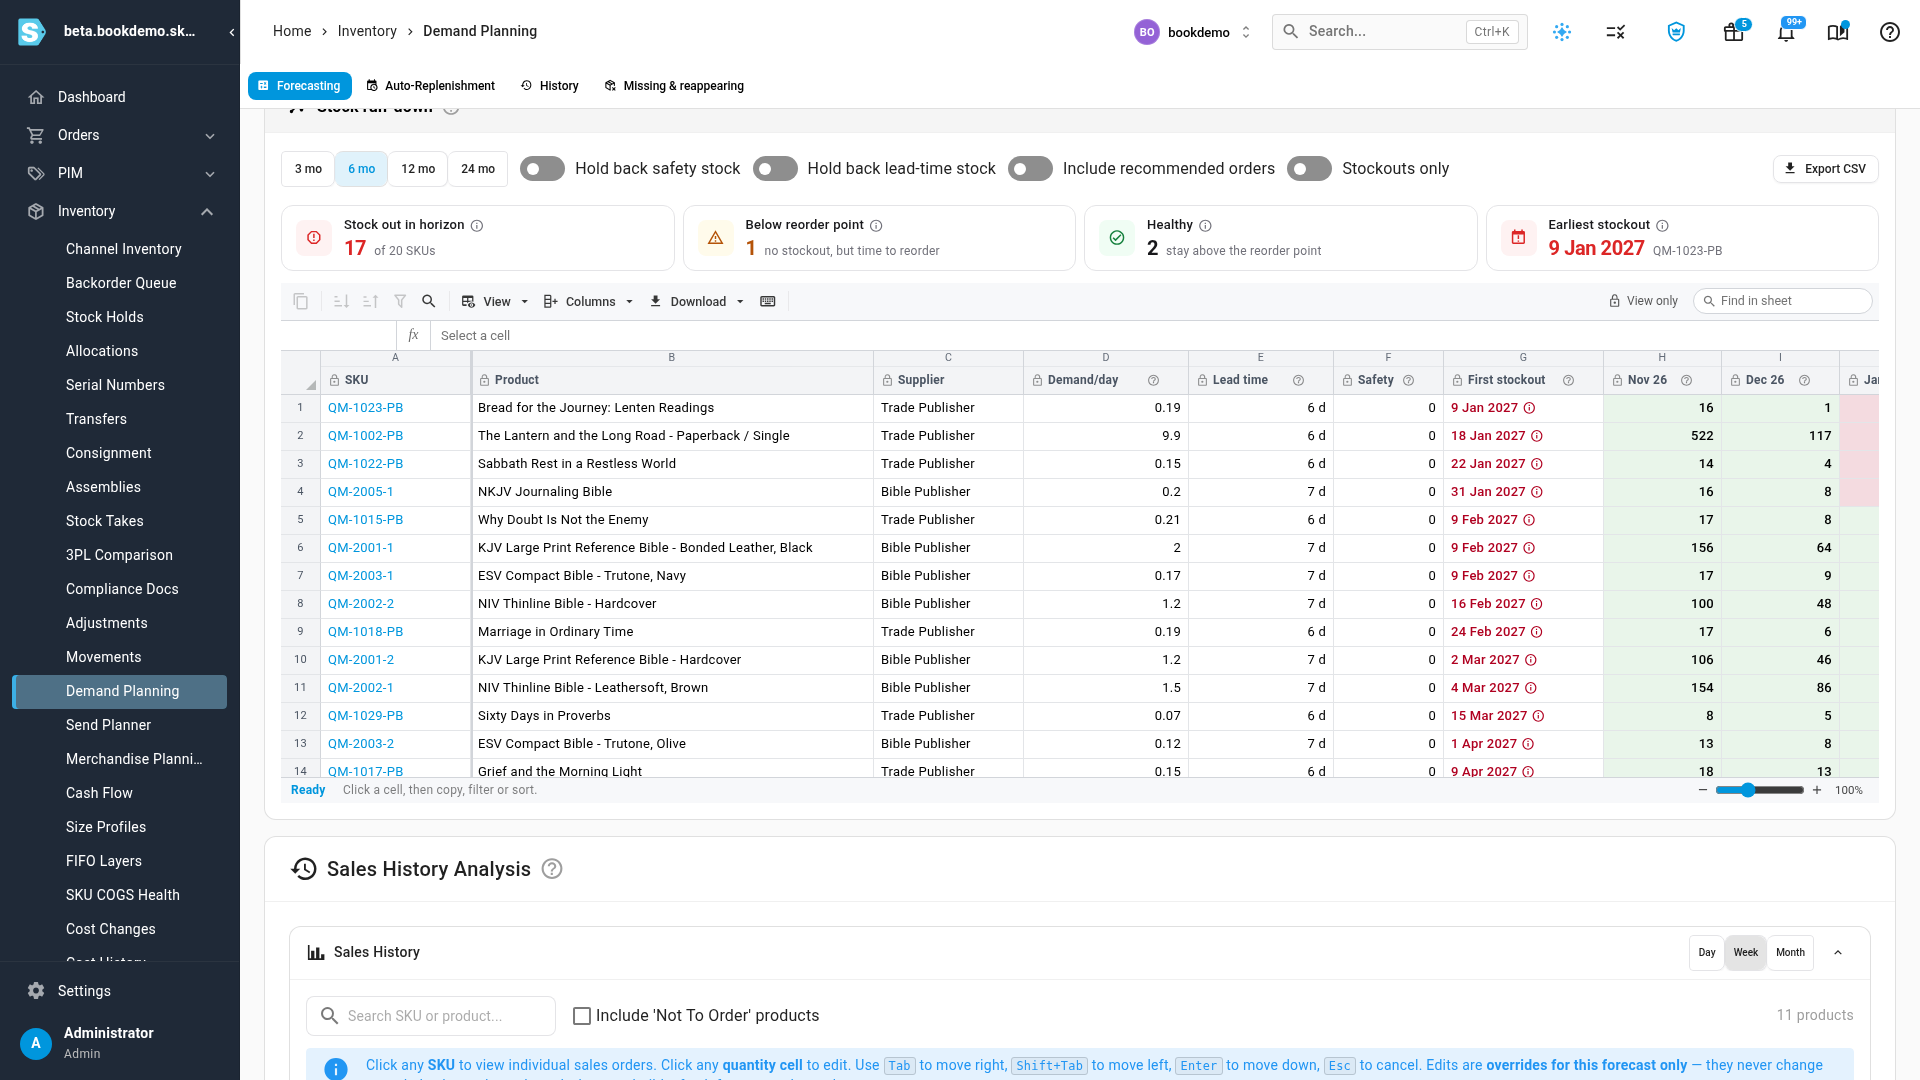
Choose how far ahead to look: 3 mo, 6 mo (the default), 12 mo or 24 mo.
-
Read the summary tiles:
- Stock out in horizon counts the products that run out within the horizon.
- Below reorder point counts those that don't run out but drop below the point where you'd reorder.
- Healthy counts those that stay above their reorder point.
- Earliest stockout names the first product to run out, and the date.
-
Read each row. Rows are sorted by First stockout, soonest first. The columns are SKU, Product, Supplier, Demand/day, Lead time, Safety (the product's Min Stock Level) and First stockout, then one column per month with the stock left at the end of that month.
-
Read the month colours:
Colour Meaning Red Usable stock goes below zero during the month. Amber Stock drops below the reorder point: safety stock plus the stock needed to cover the lead time. Green Healthy. Grey No demand is forecast. -
Hover a month to see how it adds up: the starting stock, the month's demand (with the seasonal factor, when one applies), arrivals, and the ending stock.
The first month runs from today to the end of the month, so it's marked with an asterisk.
Change what the projection counts
Use the switches above the grid:
| Switch | What it does |
|---|---|
| Hold back safety stock | Treats the Min Stock Level as untouchable, so a month turns red when stock would dip into it. |
| Hold back lead-time stock | Also holds back the stock you'd need to cover the lead time. A red month then means you've left it too late to reorder. |
| Include recommended orders | Adds the forecast's recommended order, arriving one lead time from today. Turn it on to check that ordering today fixes the stockout. |
| Stockouts only | Shows only the products that run out within the horizon. |
On a product page there's also a warehouse picker. All planning warehouses is the default.
See why a product stocks out
Click a product's First stockout date to open why it stocks out.
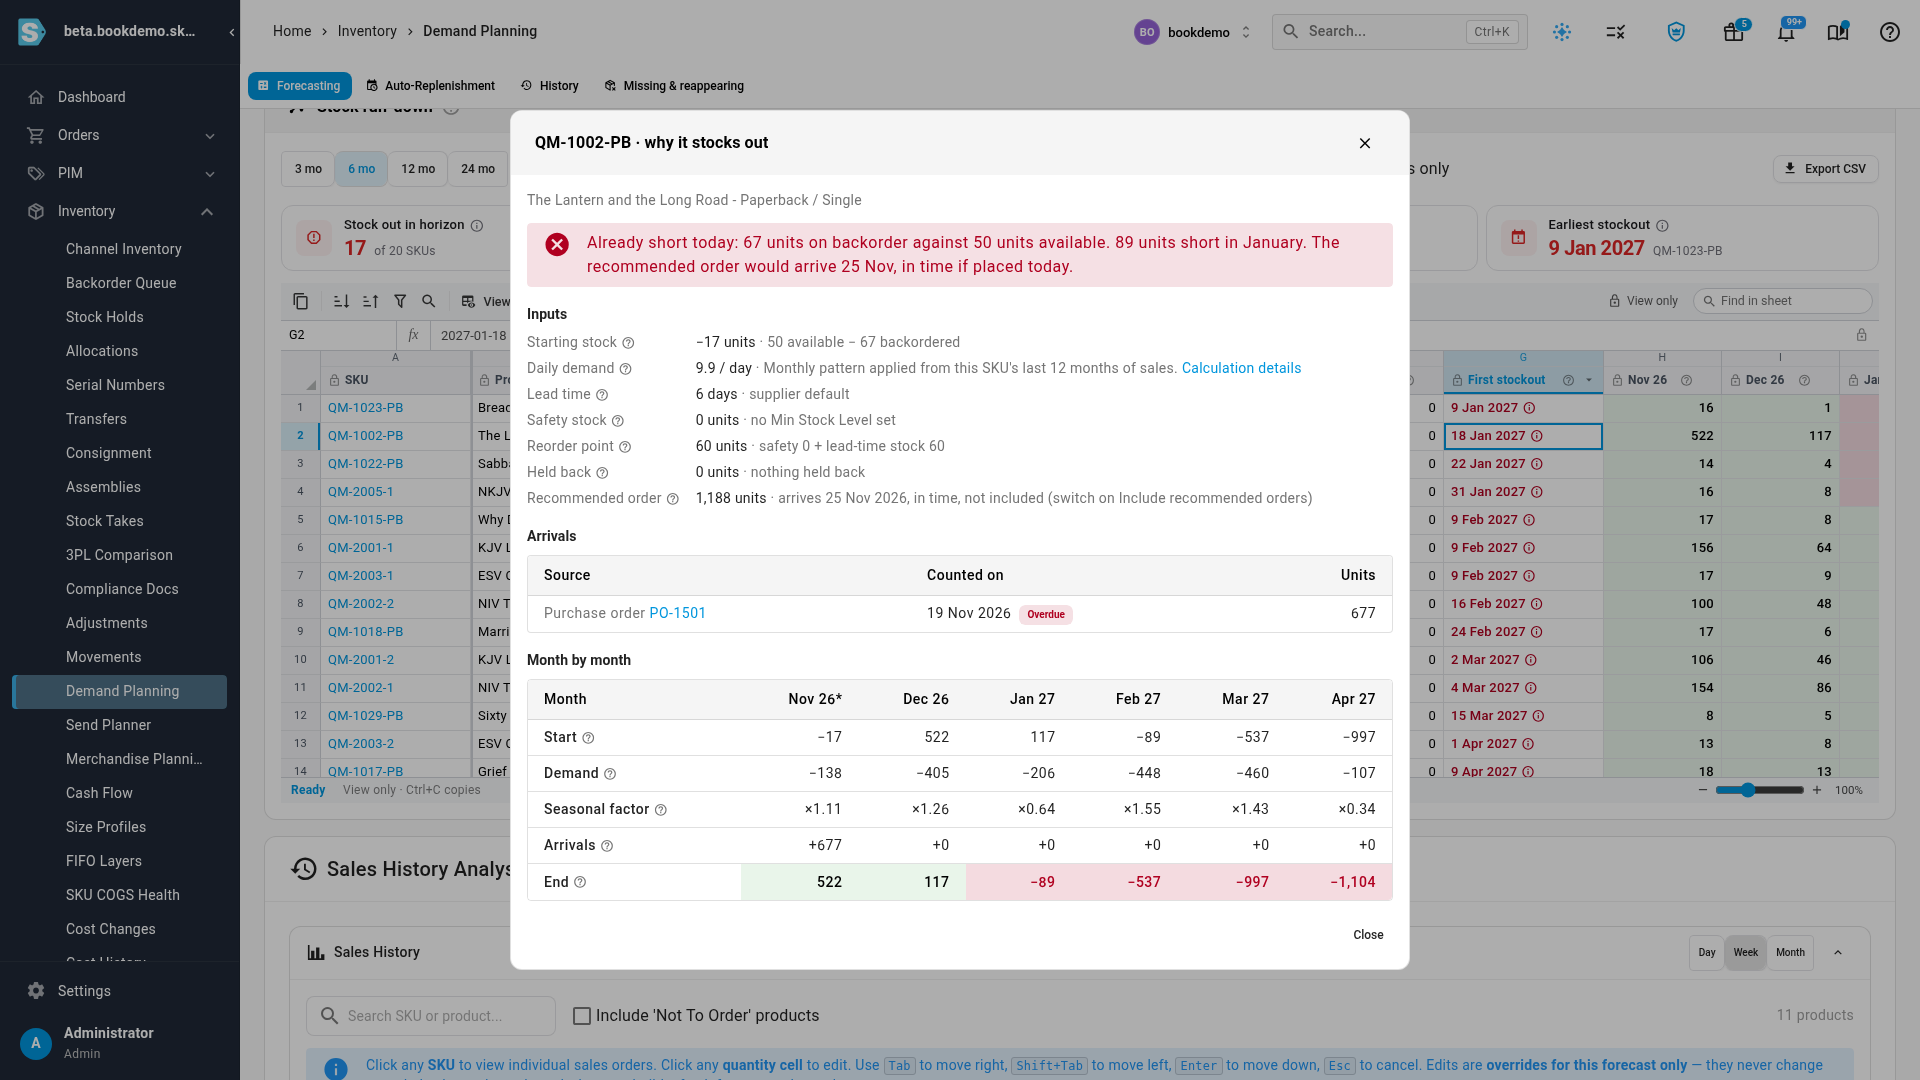
- A summary sentence, for example Already short today: 67 units on backorder against 50 units available. 89 units short in January. The recommended order would arrive 25 Nov, in time if placed today.
- Inputs: Starting stock, Daily demand, Lead time, Safety stock, Reorder point, Held back and Recommended order, each with where it came from. Calculation details opens the forecast line behind the daily demand.
- Arrivals: each purchase order or transfer on its way and the date it's counted on. No expected date and Overdue chips mark supply counted as arriving today.
- Arriving too late lists orders that land after the product has already run out.
- Month by month: Start, Demand, Seasonal factor (when seasonality applies), Arrivals and End for every month.
Fix what the run-down warns about
When something makes the projection less reliable, a warning appears with a link to fix it:
| Warning | Fix |
|---|---|
| A purchase order has no expected delivery date, so it's counted as arriving today. | Set the date on the purchase order. |
| A purchase order is past its expected date and still open, so it's counted as arriving today. | Update the date, or receive or close the order. |
| The product has no sales history. | Nothing to project yet. Demand is zero until it sells. |
| The product has no lead time. | Set lead time on the supplier product. |
| The product has no Min Stock Level. | Set Min Stock Level, if you keep safety stock. |
| The product has no supplier. | Add a supplier. Without one, the product page shows no grid. |
Export the grid
Click Export CSV to download the grid as it's shown, with your switches applied. For each month, the file has one column with the ending stock and one with its status (stockout, below reorder point, healthy or no demand). A final Late arrivals column lists orders that land after a stockout.
How the run-down is worked out
- Starting stock is the available stock minus backorders, in the warehouses the forecast plans for. FBA, supplier and excluded warehouses aren't counted. A Fill Backorders Only forecast leaves Amazon stock out and uses the supplier's own backorders.
- Demand is the forecast's daily rate. With automatic seasonality, each month uses last year's shape for that month instead of one flat rate, so the Demand/day column shows the rate for an average month. Dated events add their units on their own days.
- Arrivals count open purchase order lines on their shipment's arrival date, or on the purchase order's expected date when there's no shipment. Open warehouse transfers count on their arrival date. Undated or overdue supply counts today.
- On a product page, the forecast comes from your default saved Demand Planning configuration. Seasonality appears there only when that configuration has Seasonality set to Automatic from last year. The line under the switches names the configuration and the sales window it used.
Next steps
- Forecast demand and replenish stock to turn the products that run out into purchase orders.
- Forecast with automatic seasonality from last year so each month follows last year's shape.
- Use the Inventory Planning report to open any product's run-down from the report.
Video transcript
A reorder quantity tells you what to buy today. The stock run-down shows what happens next. Go to Inventory, then Demand Planning, from the menu on the left. Pick your suppliers, and set the target stock days. A longer target means more of your products need ordering, so the run-down has more to show. Scroll down past the options, and click Build Forecast. With four suppliers, the forecast takes a little while. When it's ready, each supplier gets a tab of results, and the run-down sits below them. The tiles count who runs out, who drops below the reorder point, and who stays healthy. Each month shows what's left at its end. Red means the product runs out. Amber means it's time to reorder. Click a first stockout date to see why. The dialog lists the inputs, the arrivals, and each month's start, demand, arrivals and end. Close the dialog. Use the switches above the grid to hold back safety stock, or to add the recommended orders.