Forecast with automatic seasonality from last year
A Sales Based forecast projects your recent sales forward. If a product sells twice as fast in December as in October, an order sized on October's sales runs short over the holidays. With Seasonality set to Automatic from last year, Demand Planning looks at how each product sold month by month over the last 12 months. It compares the months this order covers with the months your sales history covers, and lifts or lowers the daily average to match. It keeps this year's level and borrows only last year's shape.
Automatic seasonality is off until you turn it on. Existing forecasts, saved configurations and schedules don't change.
Before you begin
- Use the Sales Based forecast type with By supplier (purchase only). Make, buy & move plans, Target Stock Level and Fill Backorders Only forecasts don't use it.
- A product uses its own pattern when it has about a year of sales: its first sale is at least 12 months ago, it sold in at least 6 of the last 12 months, and it sold at least 24 units in that year. Products with less history fall back to their category's pattern, then to your manual seasonal adjustments, then to no change. See When a product doesn't have enough history.
Turn on automatic seasonality
- Go to Inventory → Demand Planning.
- In Configuration, pick the Suppliers and set Forecast Type to Sales Based.
- Set Seasonality to Automatic from last year.
- Click Build Forecast.
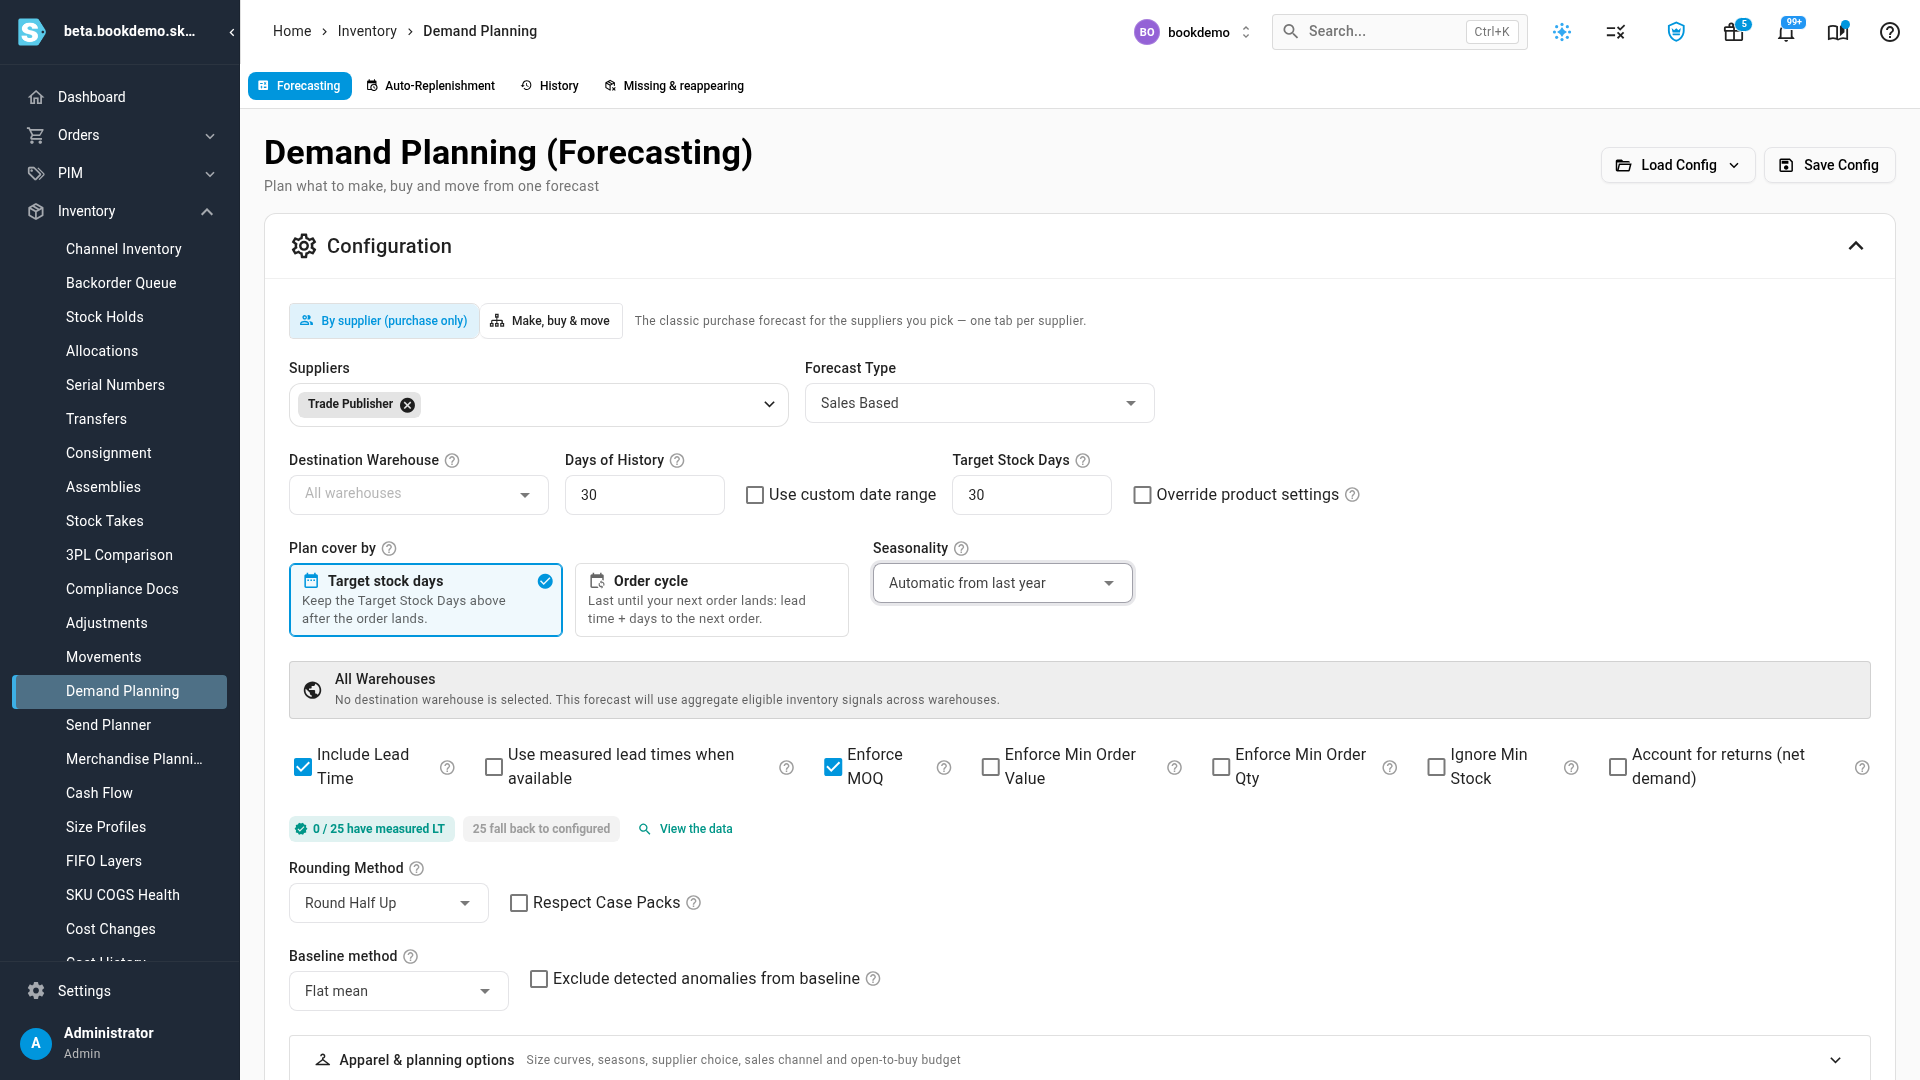
To save the setting with the rest of the forecast, click Save Config. A schedule that runs that configuration then uses automatic seasonality on every run.
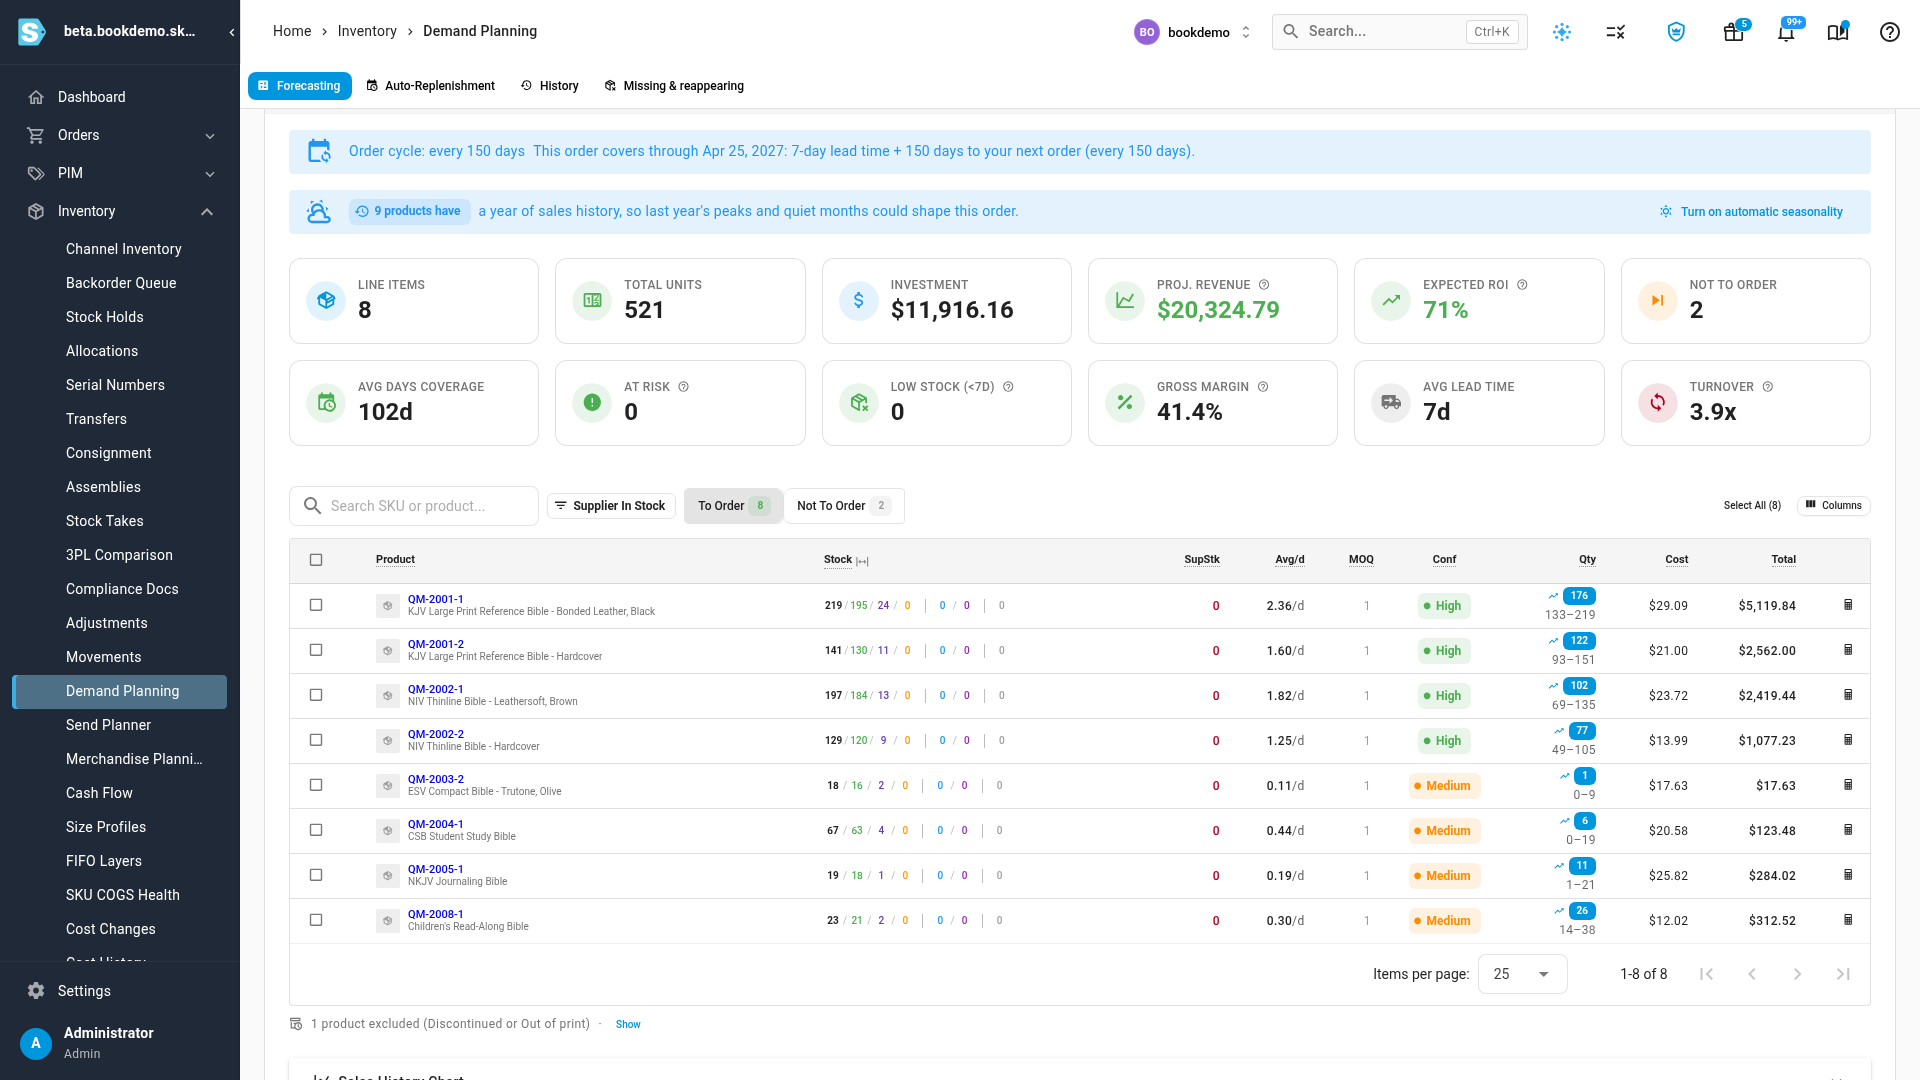
If you build with seasonality off, the results tell you when it could help, for example 9 products have a year of sales history, so last year's peaks and quiet months could shape this order. Click Turn on automatic seasonality to switch it on and rebuild. Click the count to see those products. When no product qualifies yet, the message says so.
Read the results
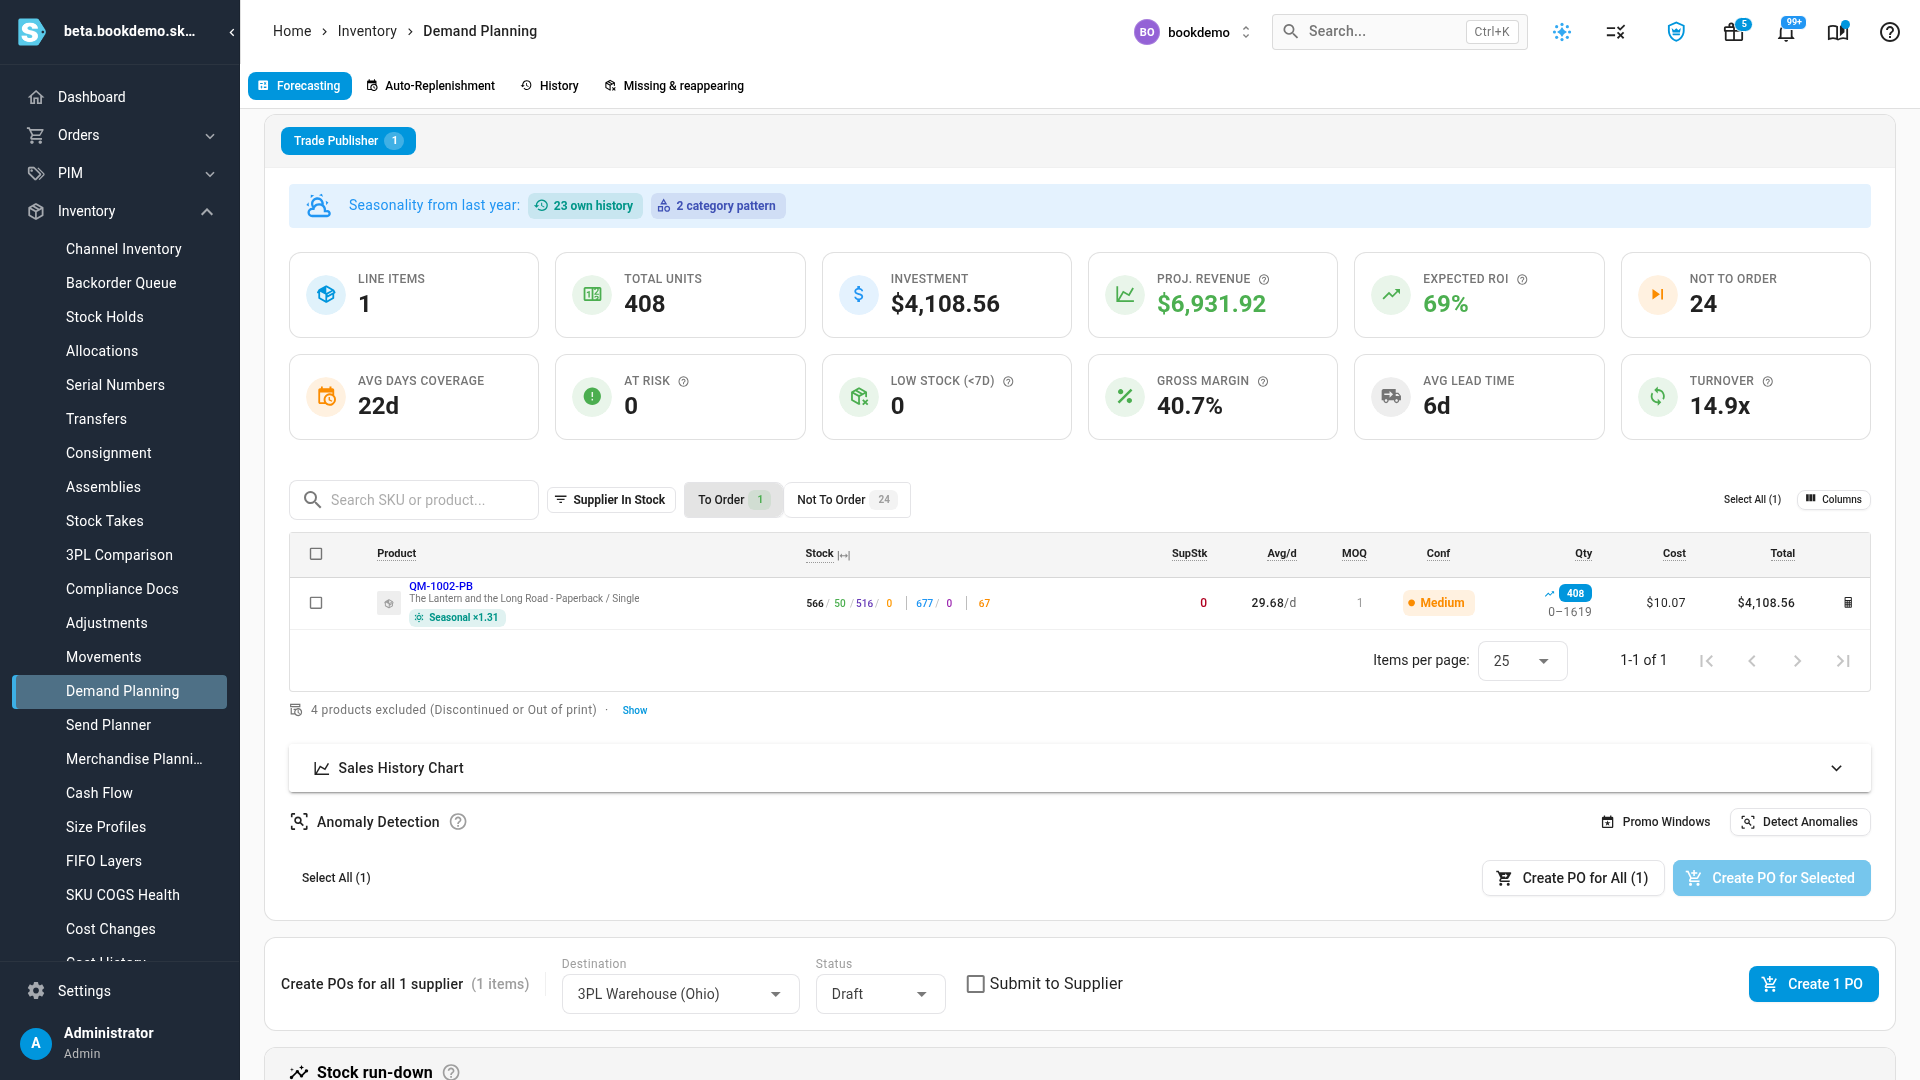
Above the results, Seasonality from last year counts how many products used each source, for example 23 own history and 2 category pattern. Products with too little history get their own chips: one for those that used your manual seasonal adjustments and one for those left unchanged. Hover a chip for what it means, and click it to show only those products in the table.
Each product line carries a chip with its factor, for example Seasonal ×1.31. A factor above 1 means last year's sales ran faster across the days this order covers than across your sales history window, so the order is larger. Below 1 means slower, so the order is smaller. Hover the chip to see which pattern it used. A line that fell back shows Seasonal: manual or Seasonal: flat, and the tooltip says why.
See how a factor was worked out
Click the calculator icon at the end of a line to open Calculation Details.
- Baseline decomposition shows the step, for example × Seasonality (×1.31, own history), between the base velocity and the final baseline.
- The bar chart shows last year's 12 months as an index, where 1.00 is an average month. The months this order covers are highlighted, and the months your sales history covers are underlined.
- The sentence under the chart gives the arithmetic, for example Last year the days this order covers ran at 1.21 of the average month and the sales history months at 0.92, so the daily average is multiplied by ×1.31.
- The table lists where each number came from: Monthly pattern, Cover window index, History window index, Seasonal factor, any Days left out, and the final Daily average.
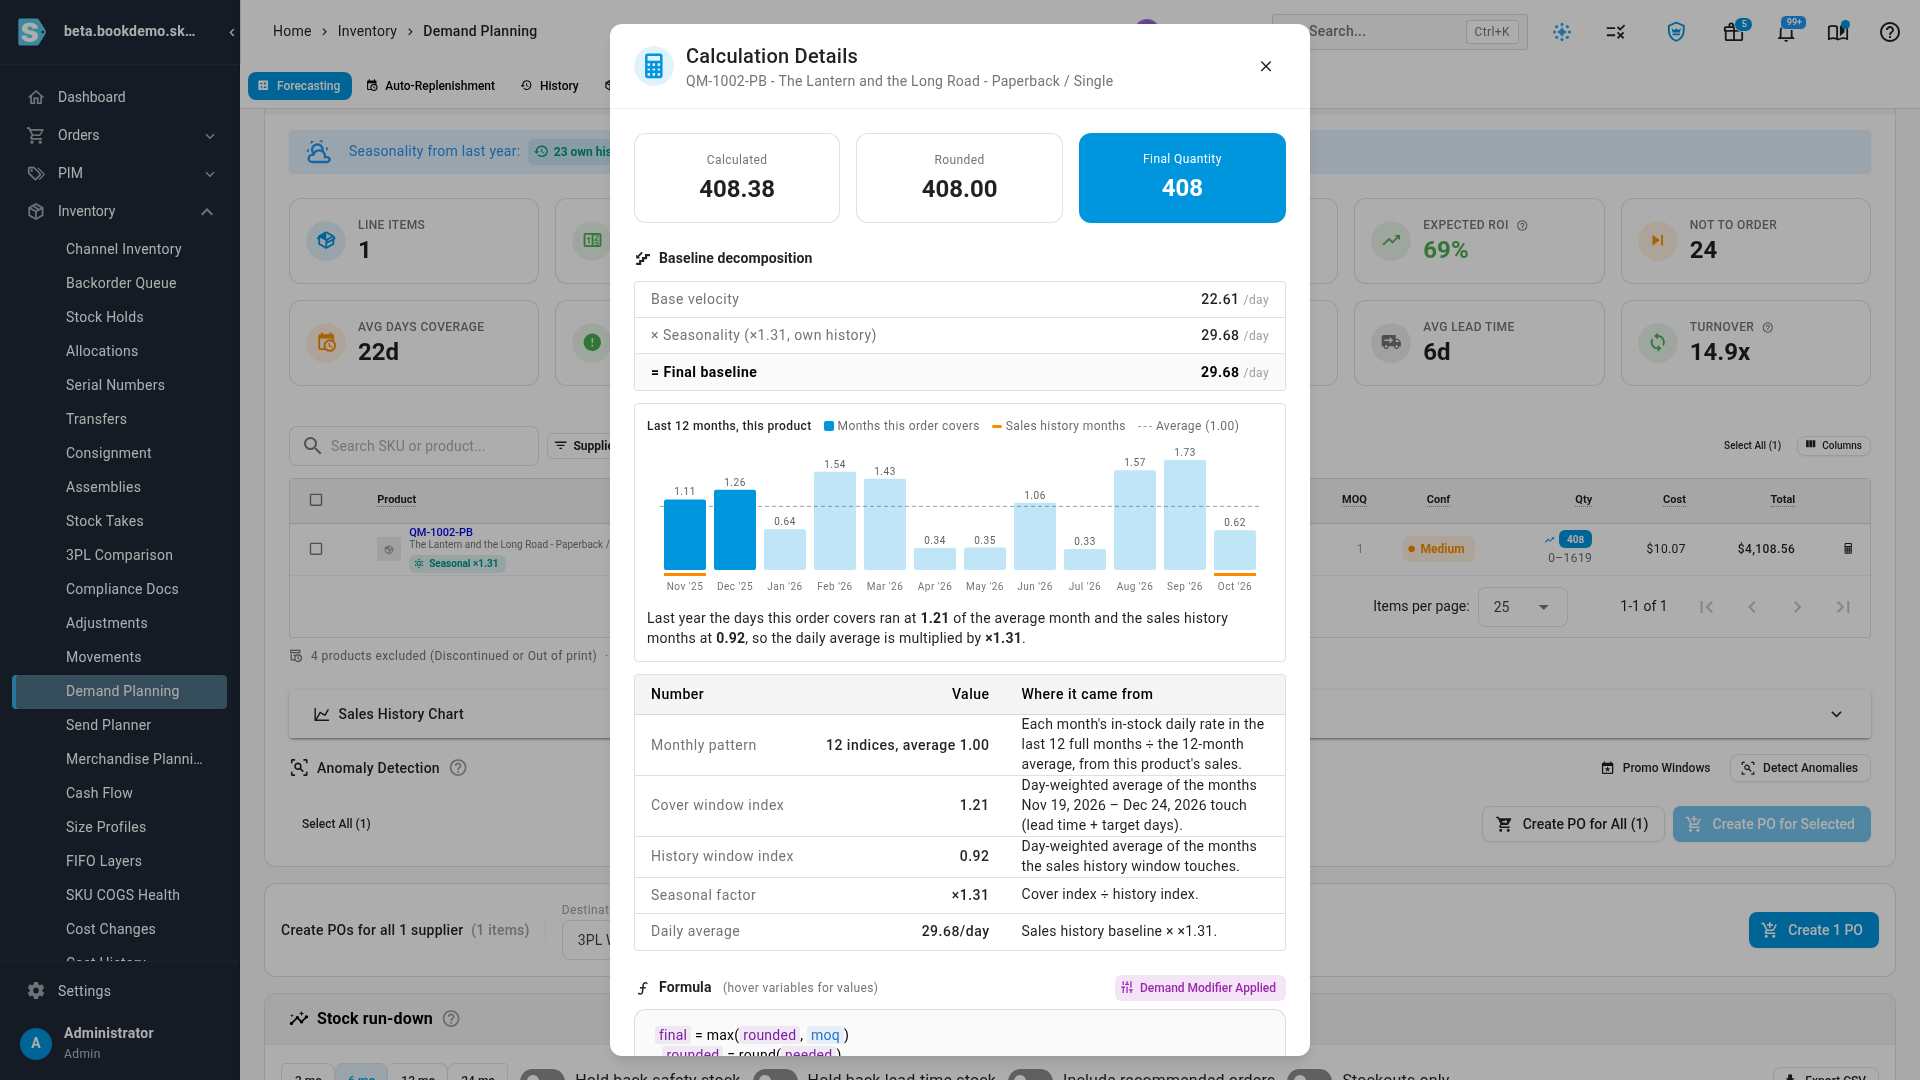
Under Calculation Inputs, Demand Multiplier shows Seasonality from last year with the same factor.
How the factor is worked out
- For each of the last 12 full months, SKU.io divides the units sold by the days the product could sell. Days it was out of stock and days inside a past promo window are left out, so a stockout doesn't read as a quiet month and last year's promotion doesn't read as a peak. With Exclude detected anomalies from baseline on, excluded anomaly days are left out too.
- Each month's rate is divided by the 12-month average, which makes an index where 1.00 is an average month. One extreme month is held at 3 times the average, or a third of it.
- The cover window runs from today through the lead time plus the target days: the days this order has to last. The history window is the sales history your forecast averages. Each window's index is the average of the months it touches, weighted by days.
- The factor is the cover window index divided by the history window index. It's held between ×0.33 and ×3.00, and the line is marked capped when the limit applies.
For example, say your sales history covers September and October, which ran at 0.8 of an average month last year. The order covers November to January, which ran at 1.6. The daily average is then multiplied by 2.0.
When a product doesn't have enough history
A product that fails a check falls back, in this order:
| Source | When it's used | What you see |
|---|---|---|
| Own history | The product passes every check. | Seasonal ×1.31 |
| Category pattern | The product is too new or sells too rarely, but its primary category has a year of history from at least 3 products that sold. | Seasonal ×1.18, with the category named in the tooltip |
| Manual adjustments | Neither has enough history, and you've entered Seasonal Adjustments under Demand Modifiers. | Seasonal: manual |
| Flat | None of the above. | Seasonal: flat, factor ×1.00 |
The reason appears in the tooltip and in Calculation Details, for example:
- Only 7 months of sales history (needs 12)
- Sold in only 3 of the last 12 months (needs 6)
- Only 9 units sold last year (needs 24)
- Out of stock most of December last year (3 in-stock days): a month the order or the history touches had fewer than 7 days the product could sell.
If no product in the forecast gets a pattern, the banner says None of these products has 12 months of sales history yet, so no automatic seasonality was applied. Click Add seasonal adjustments to open Demand Modifiers and enter them by hand.
How it works with your other settings
| Setting | With automatic seasonality on |
|---|---|
| Seasonal Adjustments under Demand Modifiers | Applied only to products that fall back to Manual adjustments. Products with their own or their category's pattern skip them, so the season isn't counted twice. See Forecast demand and replenish stock. |
| Baseline method with a trend | The trend is removed on products that got a pattern, and Calculation Details lists Trend as not applied. A trend measured during last year's run-up to a peak is the season itself. Products that fell back keep their trend. See Forecast with trend-aware baselines. |
| Event Modifiers and dated promotions | Unchanged. Their units add on top. |
| Growth Rate, overrides and other percentage modifiers | Unchanged. They apply after the seasonal factor. |
| Apparel & planning options with a season picked | The apparel season's own Seasonality setting applies instead. Without a season picked, this one applies. |
| Stock run-down | The stock run-down spreads the same pattern month by month, so its months follow last year's shape. |
Next steps
- Read the stock run-down grid to see each product's stock month by month with the seasonal pattern applied.
- Plan cover by order cycle to size the order to last until your next order lands.
- How sales velocity and days of supply work for the numbers the factor scales.
Video transcript
A forecast built on recent sales doesn't know which months sell faster than others. Go to Inventory, then Demand Planning, from the menu on the left. Click the Suppliers list, and pick a supplier whose products have sold for a year or more. Close the list once you've picked it. Keep the Sales Based forecast type. Set Seasonality to Automatic from last year. Scroll down past the options to the bottom of the form. Then click Build Forecast. The results take a few seconds. A banner counts which products used their own history, and which used their category's pattern. Each line shows its factor. Here, last year's sales ran about thirty percent faster over the days this order covers. Open the line's calculation details. The chart shows last year's months, with the months this order covers highlighted. Under it, the table explains where each number came from.