Demand planning results now open summary-first
Under a demand-planning forecast, the stock run-down used to open as a full month-by-month spreadsheet, with the sales history and demand projection tables stacked underneath. That's a lot to take in when all you want to know is what runs out first. The results now open summary-first: the Stock run-down shows the products that need attention, and the detail sits one click away.
✨ What this means for you:
- See which products run out, and when, without scrolling through a spreadsheet.
- Keep the full month-by-month grid one click away with Open as sheet.
- Work on one panel at a time: Stock run-down, Sales history and Demand projection are now tabs, each with a line that says what editing it changes.
The products that need attention, first
The Stock run-down opens with four tiles (Stock out in horizon, Below reorder point, Healthy and Earliest stockout) and a short list of the products that need attention first, soonest stockout first. Each dot is one month: red runs out, amber dips below the reorder point, green stays healthy. Click a product's First stockout date to see why it runs out.
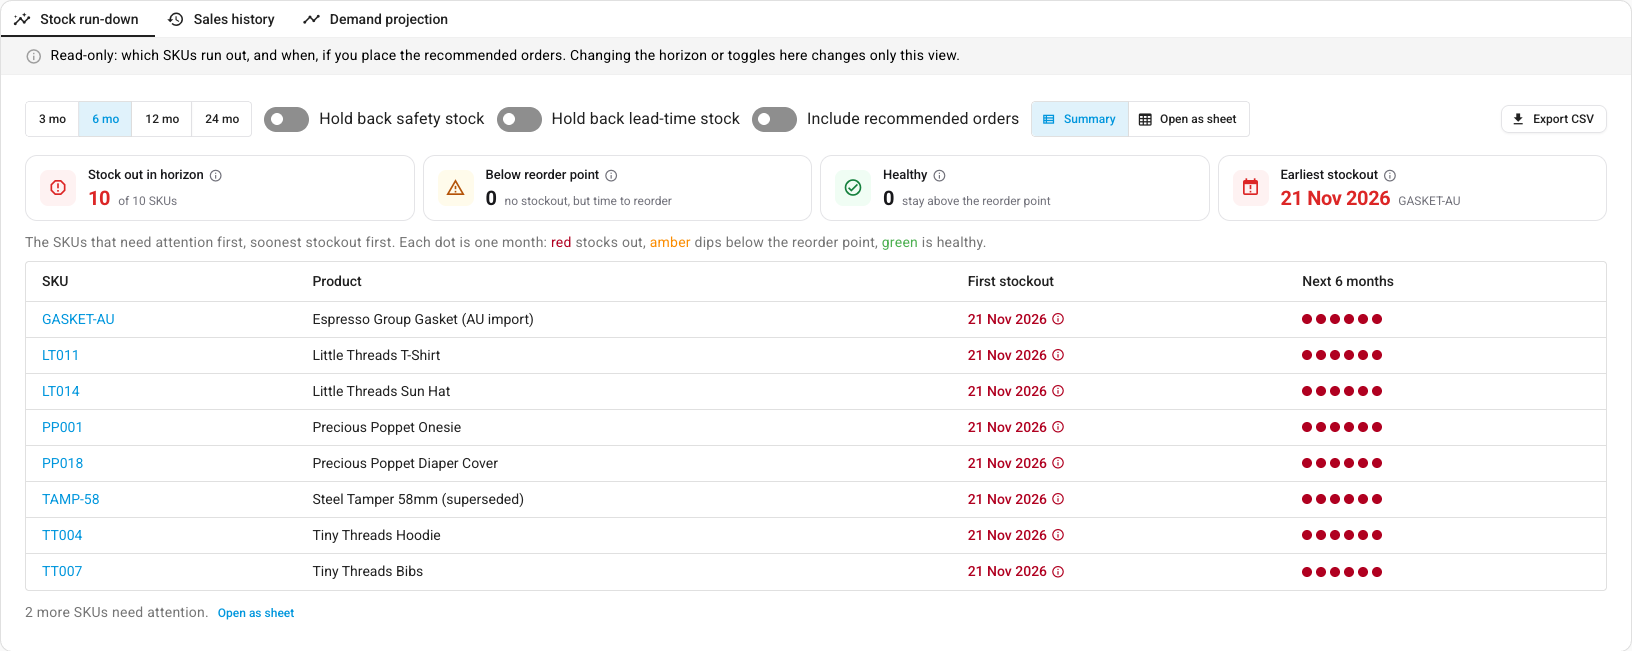
When you want every product month by month, click Open as sheet. Summary takes you back.
One panel at a time
Stock run-down, Sales history and Demand projection now share one card as tabs. A line under the tabs says what editing that tab changes. The run-down is read-only, sales history changes the daily average behind every order quantity, and demand projection changes the order quantities directly. Each tab has its own link, so you can bookmark the one you use most.
Where to find it
Go to Inventory → Demand Planning and build a forecast. The tabs are under the results.
Full guide: Forecast demand and replenish stock