Sizes and colours — buy the size run your customers actually buy
If you sell apparel, you don't buy a style: you buy a size run. Order every size evenly and you sell out of the middle sizes while the ends sit on the shelf. A style's stock is spread across dozens of variants, so spotting the gaps means scrolling a long list. Sizes and colours puts the size run front and centre. Derive a size curve from how a style really sold. See its stock as a grid of sizes and colours and reorder the gaps in one go. Compare sizes across every vendor in one report.
✨ What this means for you:
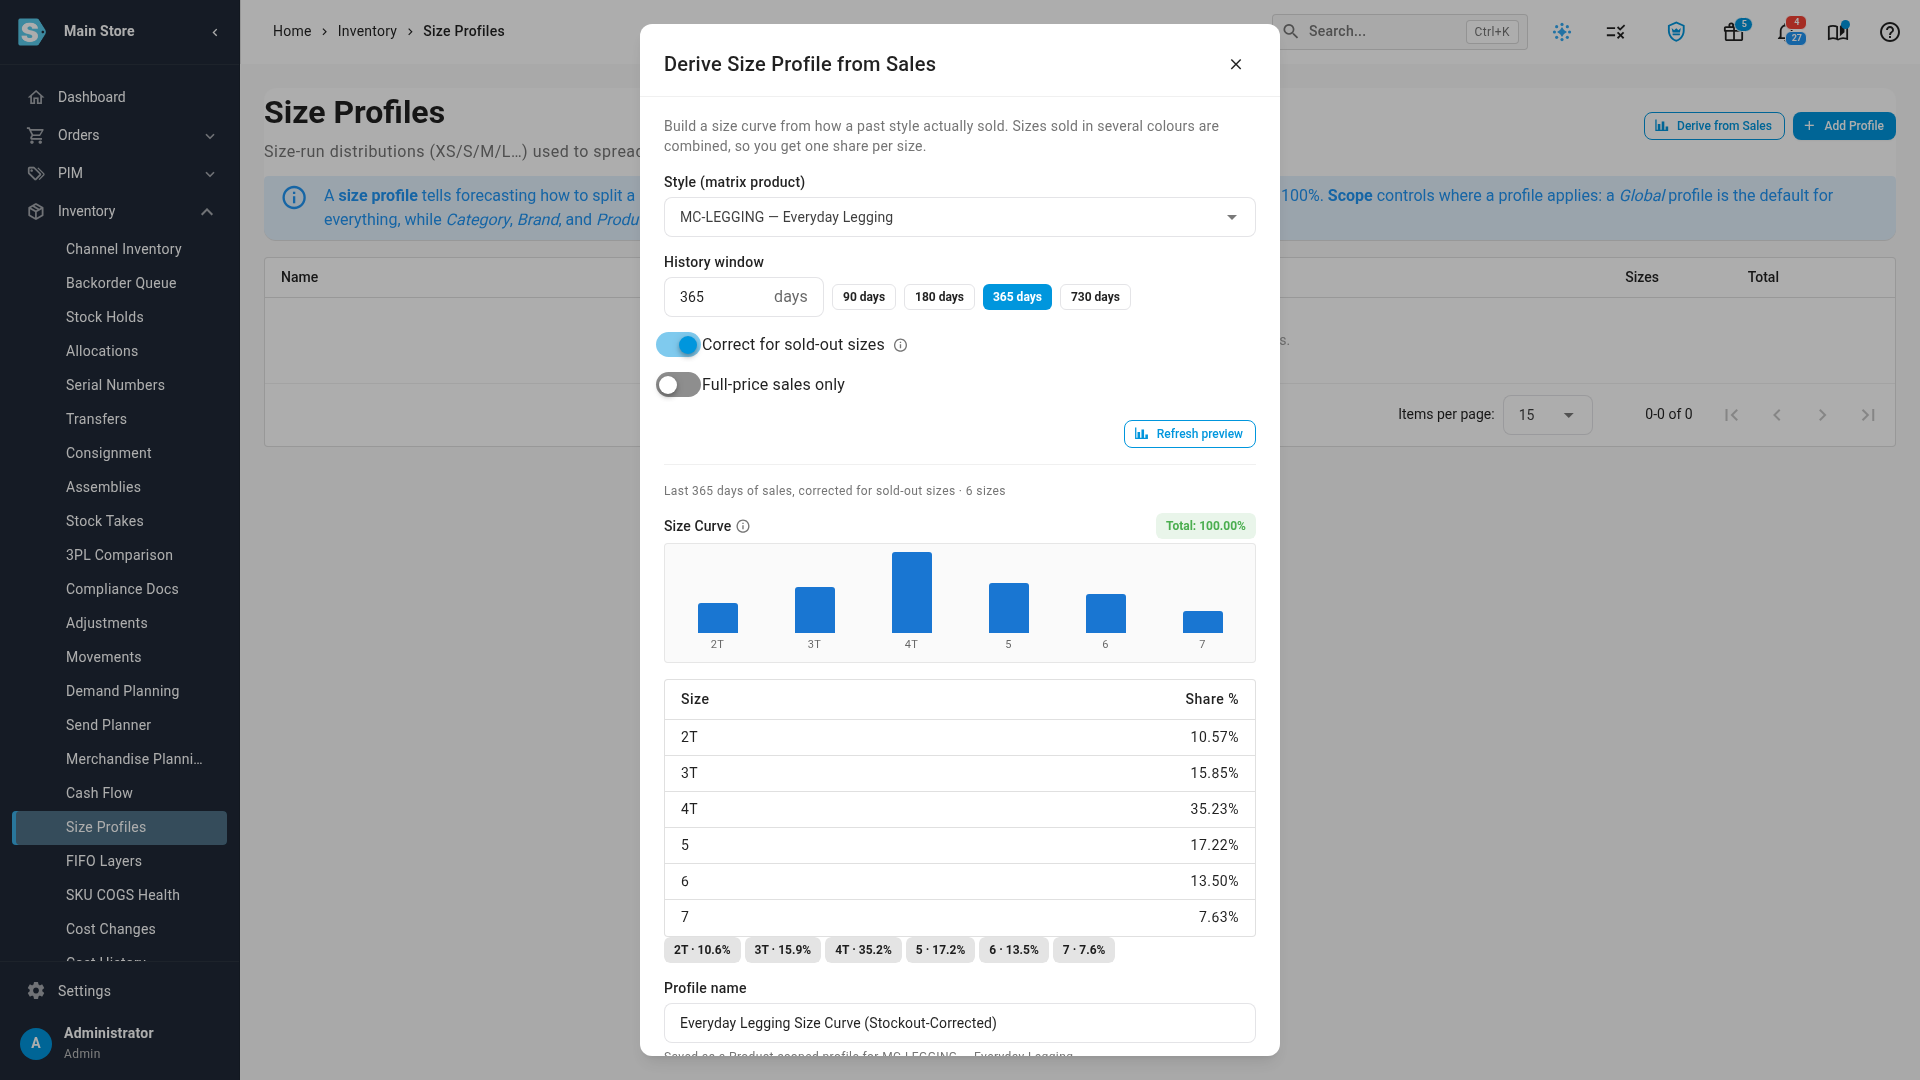
- Size curves from real sales, corrected for sizes that sold out early so your best sellers aren't under-bought.
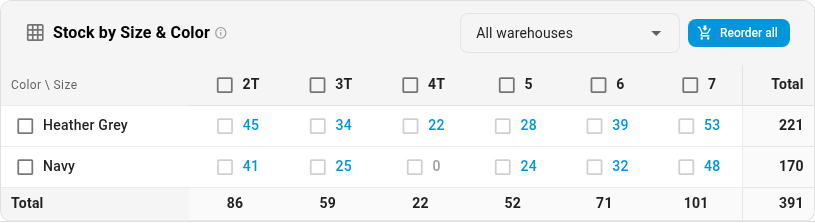
- A Stock by Size & Color grid on every style's product page, with one-click reordering of the gaps.
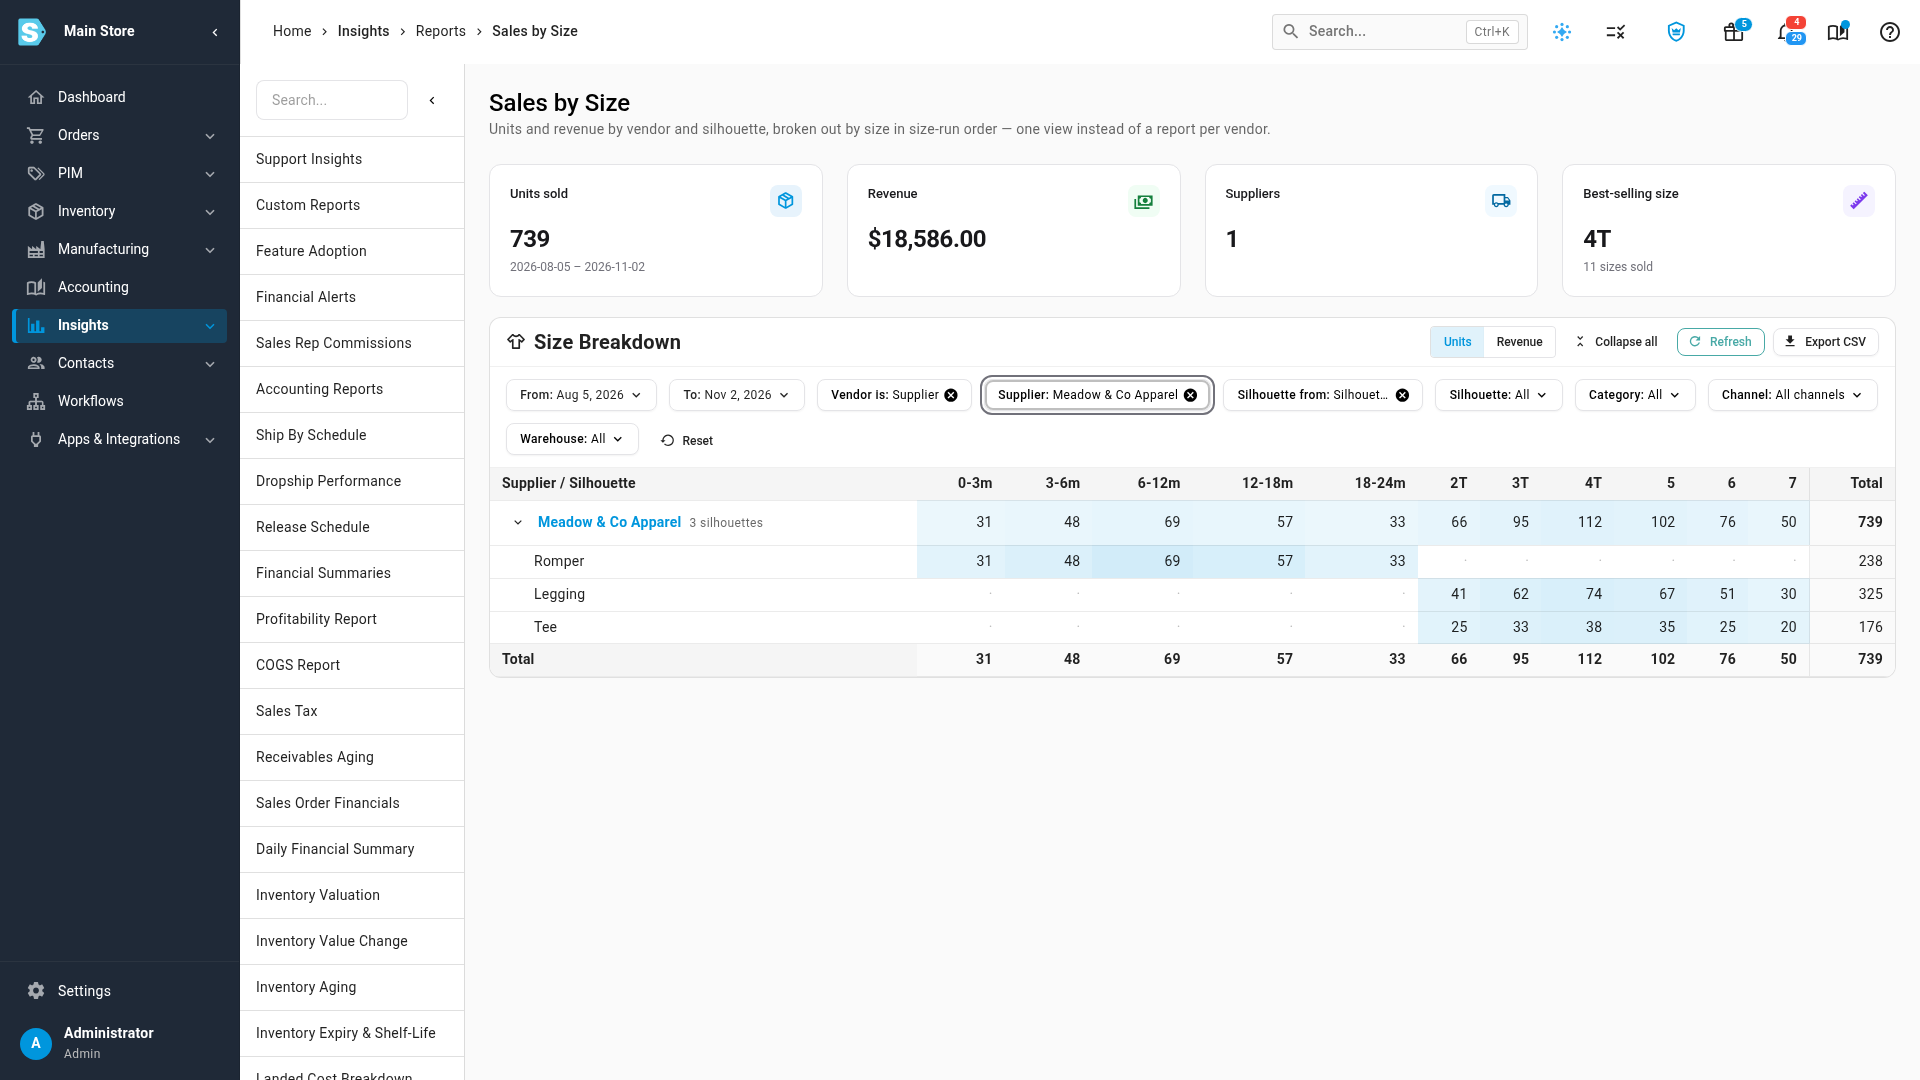
- A Sales by Size report: units and revenue for every size, by vendor and silhouette, in size-run order.
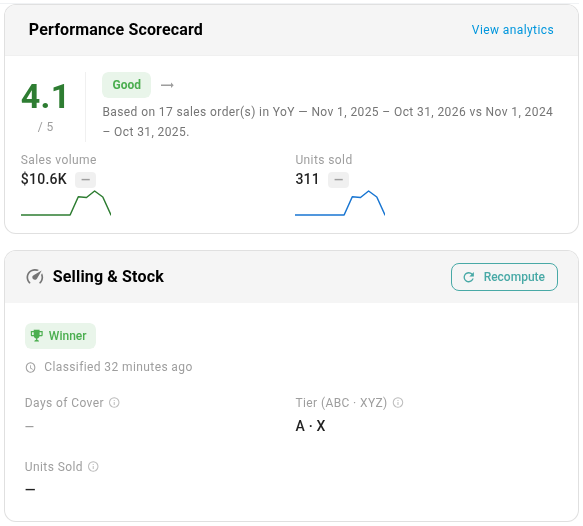
- Velocity labels and scorecards that are right for styles. A style is now labelled and scored from its variants' combined sales, so a best-selling style shows as a Winner instead of looking idle.
Build a size curve from how a style sold
On Inventory → Size Profiles, click Derive from Sales, pick the style and a history window, and preview its curve. Turn on Correct for sold-out sizes: a size that ran out early is weighted on how fast it sold while it was in stock, so its share isn't understated. Full-price sales only leaves markdown sales out. Sizes sold in several colours are combined into one share per size. Save the result as a size profile, and forecasts split a style's buy across sizes the way your customers buy.
See a style's stock by size and colour
Open a style under PIM → Products and scroll to Stock by Size & Color: one row per colour, one column per size, with totals for each. A zero stands out straight away. Pick a warehouse to see one location, and hover a cell for available and allocated stock. Tick the gaps, a whole colour or a whole size, or click Reorder all. The reorder window groups lines by supplier with suggested quantities, and creates draft purchase orders.
Compare sizes across every vendor
The new Sales by Size report, under Insights → Reports, shows units and revenue for every size in one view, instead of a report per vendor. Sizes run left to right in size-run order, grouped by vendor and then by silhouette. The cards up top show units sold, revenue, the number of suppliers and the best-selling size. Filter by supplier, silhouette, category, channel or warehouse, and export the table to CSV.
Velocity labels now work for styles
Products carry a velocity label, Winner, Chaser, Steady, Slow mover or Dormant, on the product page and in the product list. A style doesn't sell under its own SKU: its variants do. So styles used to look like they weren't selling at all. A style's label and its Performance Scorecard now roll up from its variants' combined sales, so a strong style reads as a Winner or Chaser, scored on the orders its sizes actually took.
Where to find it
- Size curves: Inventory → Size Profiles → Derive from Sales.
- Size × colour grid and reorder: PIM → Products → (a style) → Stock by Size & Color.
- Sales by Size: Insights → Reports → Sales by Size.
Full guide: Build size curves from sales. See also See and reorder stock by size and colour and Read the Sales by Size report.