Buyer analytics for apparel and footwear — see what sells, by any attribute, and what you can still buy
Buying apparel and footwear comes down to the same questions every season. Which silhouettes are winning inside each brand? Which sizes keep selling out, and what did that cost you? How much sold at full price? Did the last delivery sell through? And how much can you still spend? Answering them used to mean pivoting sales exports by hand. Buyer analytics answers them in SKU.io: the new Assortment Explorer, stockouts and returns by size, two sell-through reports, and Buyer home, which puts it all on one page with your open-to-buy.
✨ What this means for you:
- Winners, chasers and losers by any attribute. Group sales by brand, silhouette, gender, size, fabric, print, colour, season or any product field, up to four levels deep, and see why each row is labelled the way it is.
- The sales sold-out sizes cost you. Stockout days and an estimate of lost units and sales for every size, with a confidence flag, plus why customers sent each size back.
- Size curves for a whole category or brand, so rain boots, sandals and sneakers each get their own curve.
- How every unit was priced: full price, clearance, specials, promotions, coupon codes or staff discounts, each unit counted once.
- How each delivery sold within 30, 60 and 90 days of arriving, after returns.
- Buyer home: three dashboards under one set of filters, with a cost budget, what your purchase orders commit, and a recommended next buy you can turn into draft purchase orders.
Find winners and losers by any attribute
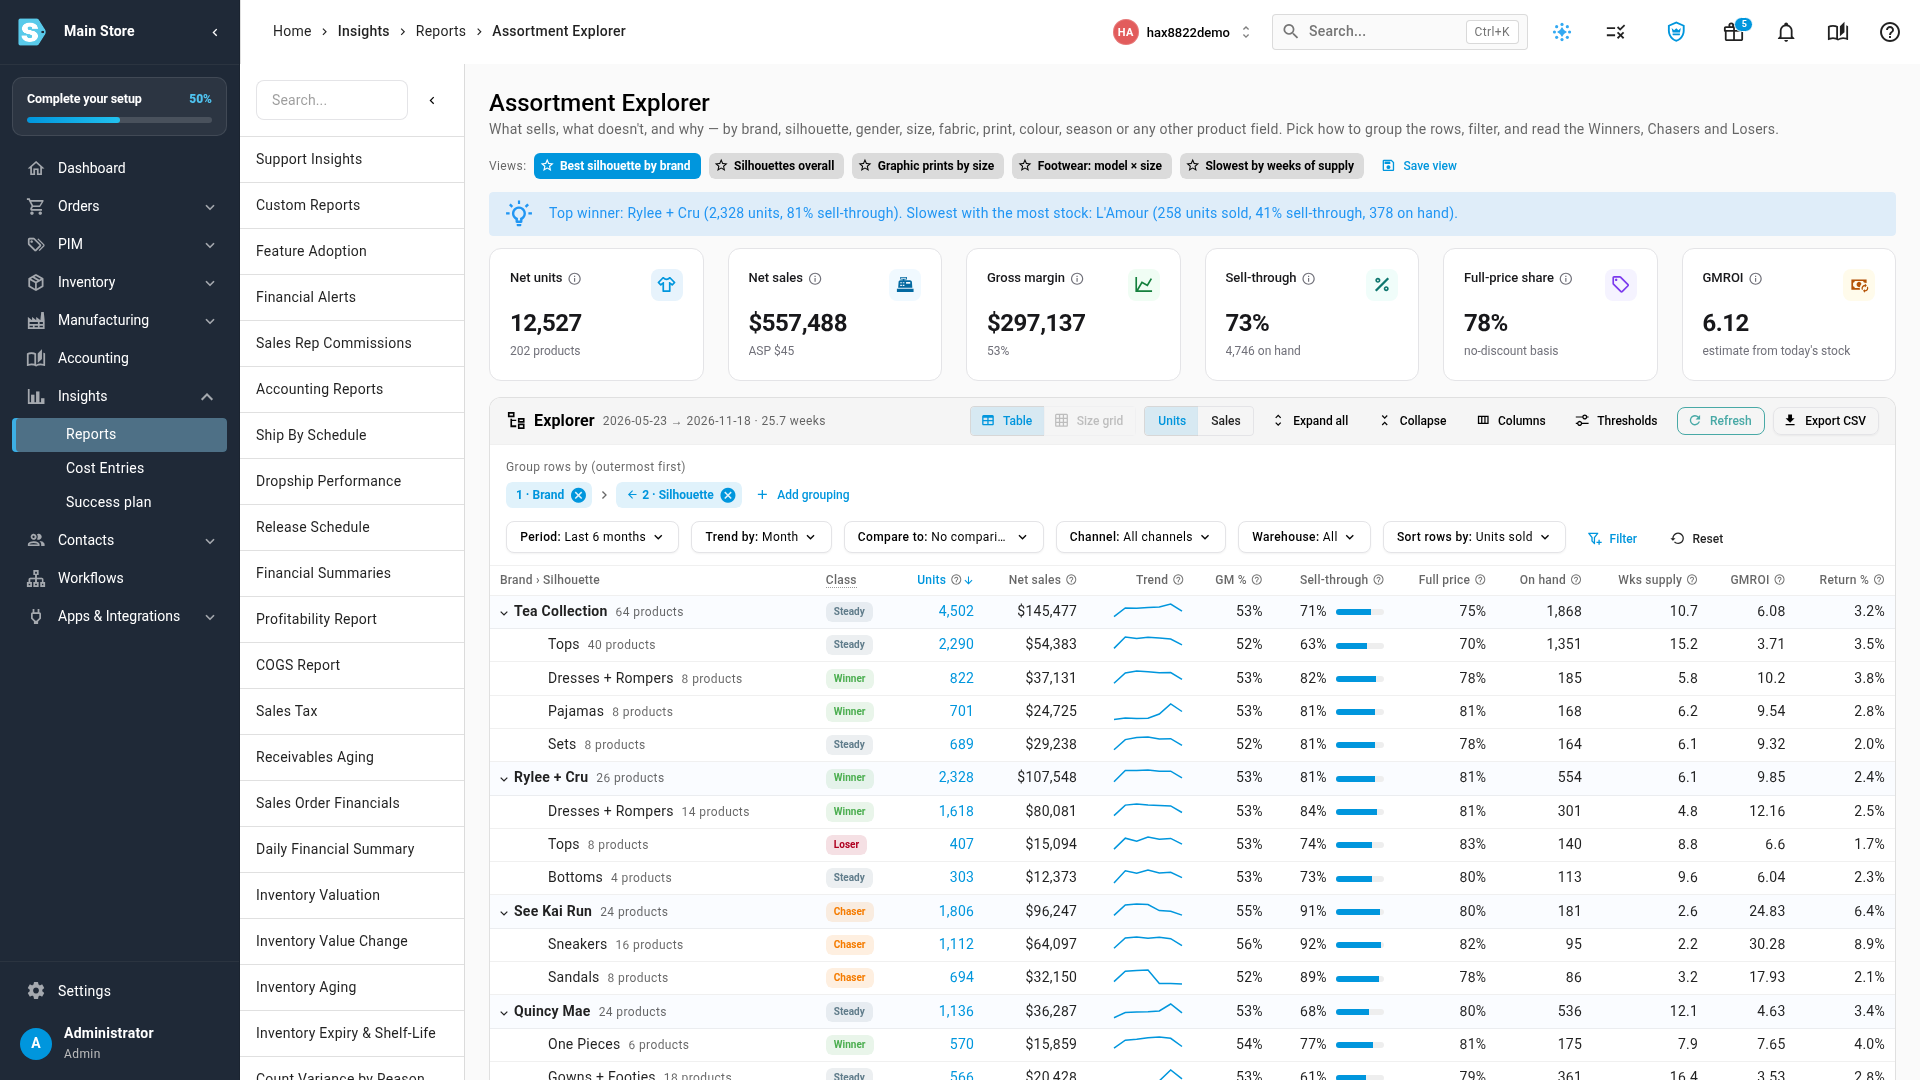
The Assortment Explorer shows what sells and what doesn't across any mix of product fields. It opens on Best silhouette by brand: each brand, with its silhouettes nested underneath. Every row shows units, net sales, margin, sell-through, full-price share, on hand, weeks of supply, GMROI and return rate. Each row is labelled Winner, Chaser, Steady or Loser against the row it sits under. Hover the label to read why. A Chaser is selling fast enough that you should reorder before it runs out.
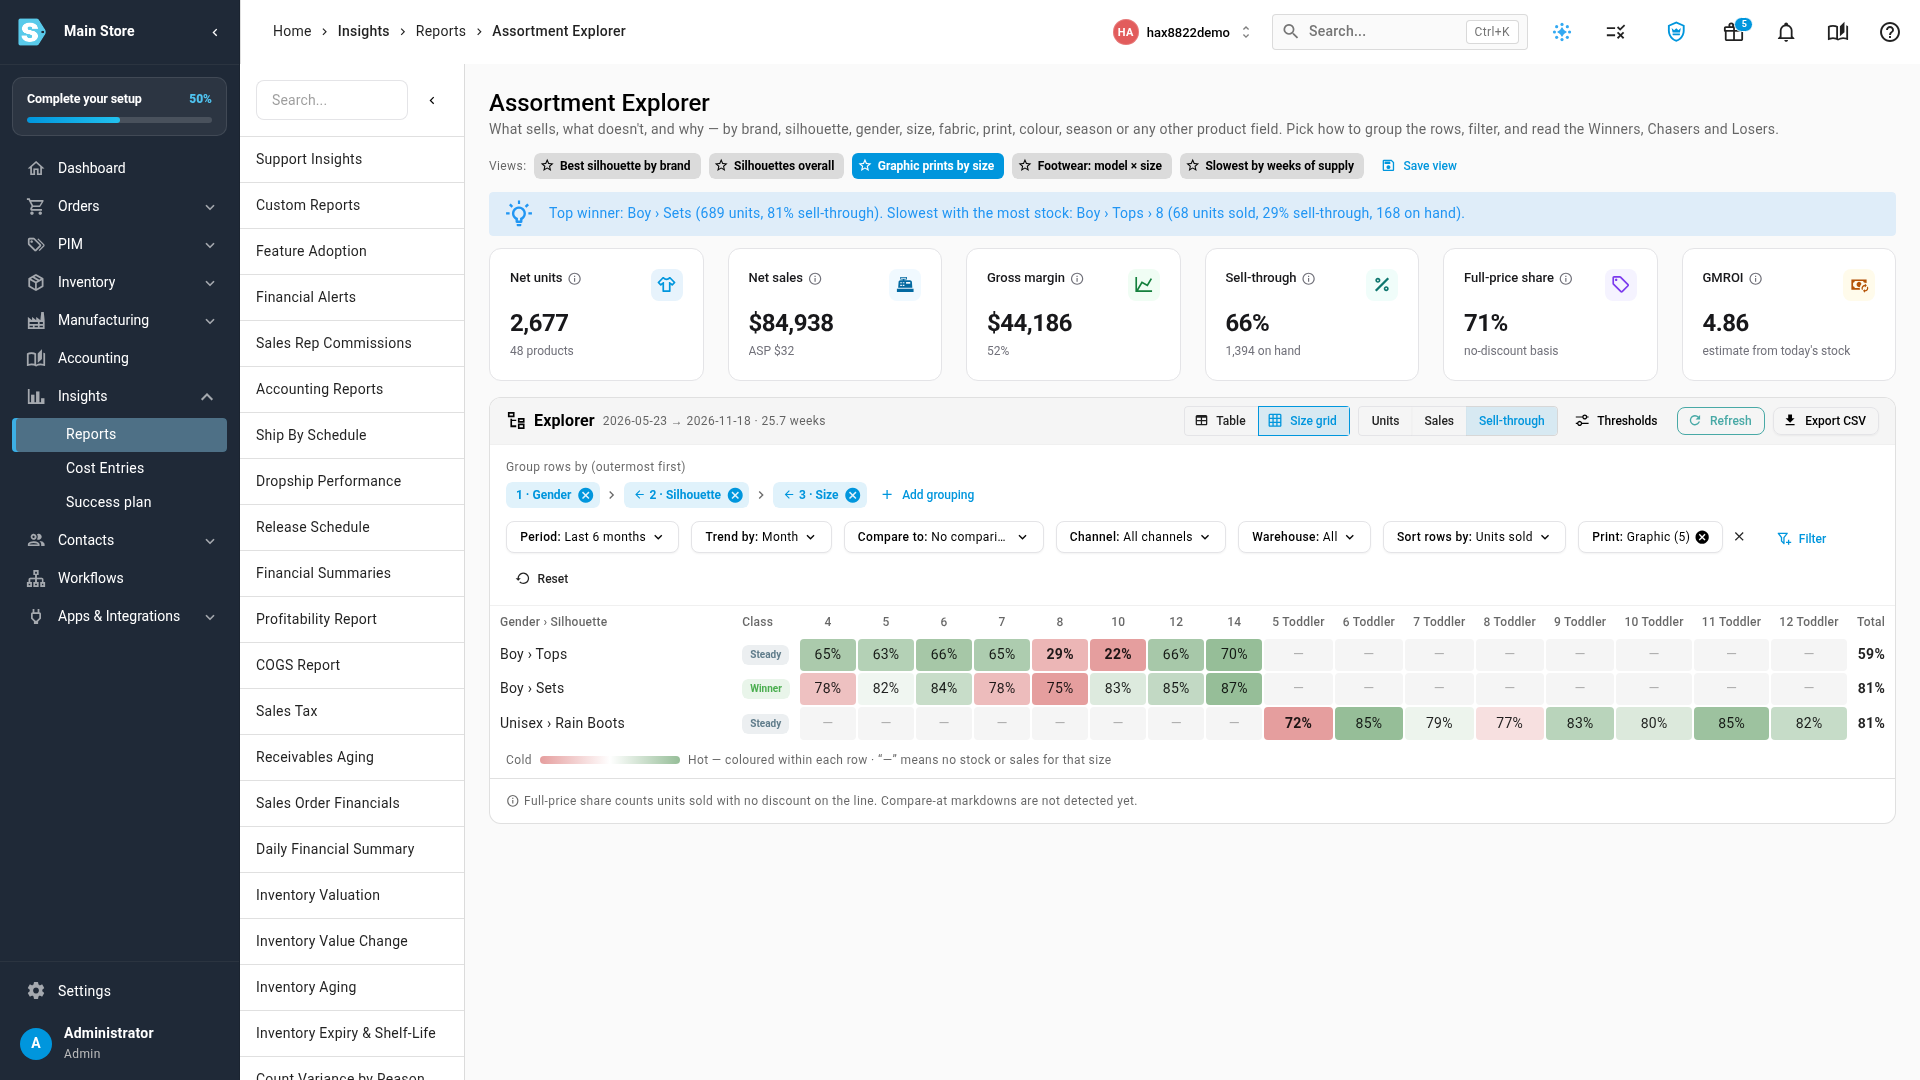
Pick Add grouping to group by any product field, up to four levels deep. When the last level is a size, switch to Size grid: sizes become columns in size order, and each row's slowest cells turn red. Click any number to see the products behind it, then Save view to keep the setup or Export CSV to take the whole table with you.
See which sizes lose sales to stockouts
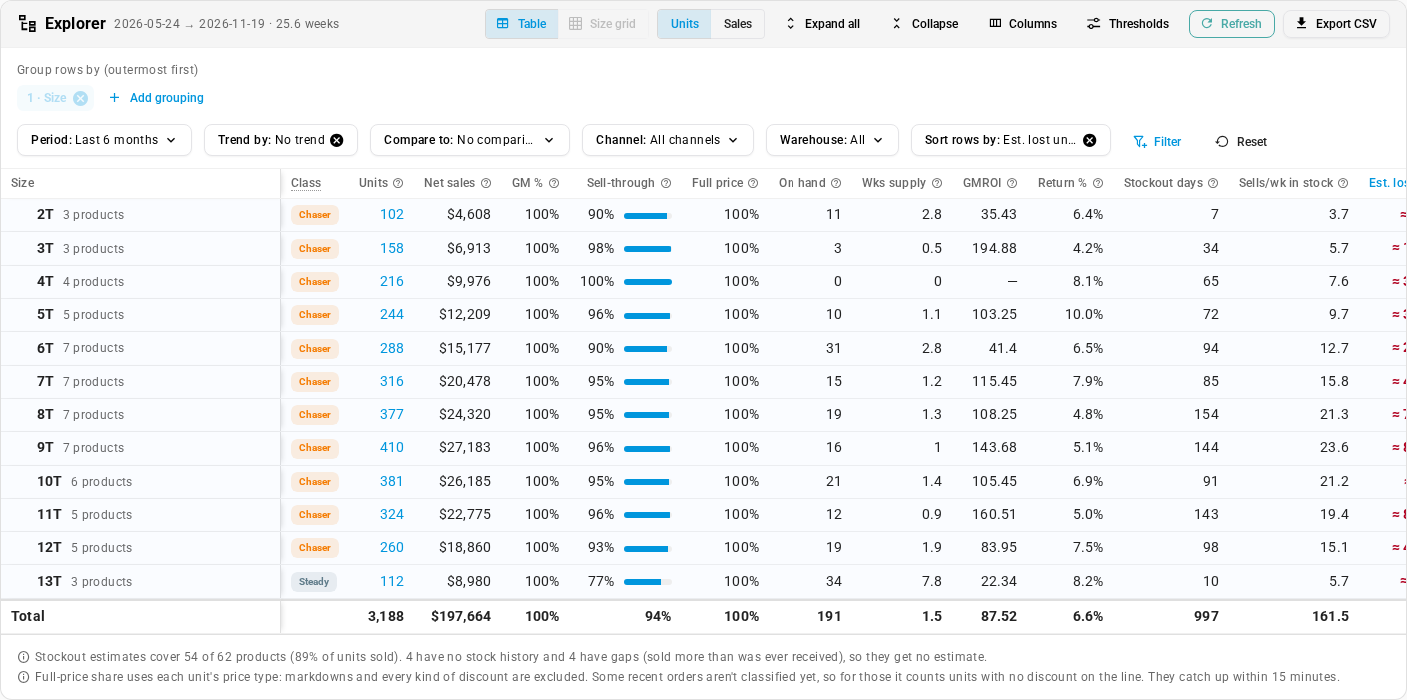
Add Stockouts & lost demand under Columns in any view, or open the Sizes losing sales to stockouts starter view. For each size you see how many days it was sold out, how fast it sold while it was in stock, and an estimate of the units and sales it missed. Estimates always show ≈ with a High, Medium or Low confidence flag, and they're never added to your sales totals. A note under the table says how much of your sales has the stock history an estimate needs.
Return reasons works the same way. Returns by size and reason shows each size's return rate, the share returned for fit, and a bar of the reasons. A reason written only in the customer's note, such as "runs narrow", still counts under fit. Footwear: brand › category › size is the third new starter view.
Size curves can now pool a whole category or brand, too. On Inventory → Size Profiles → Derive from Sales, choose A category (optionally for one brand) or A brand. Each curve carries a confidence flag, so curves built on few sales stand out.
See how every unit was priced
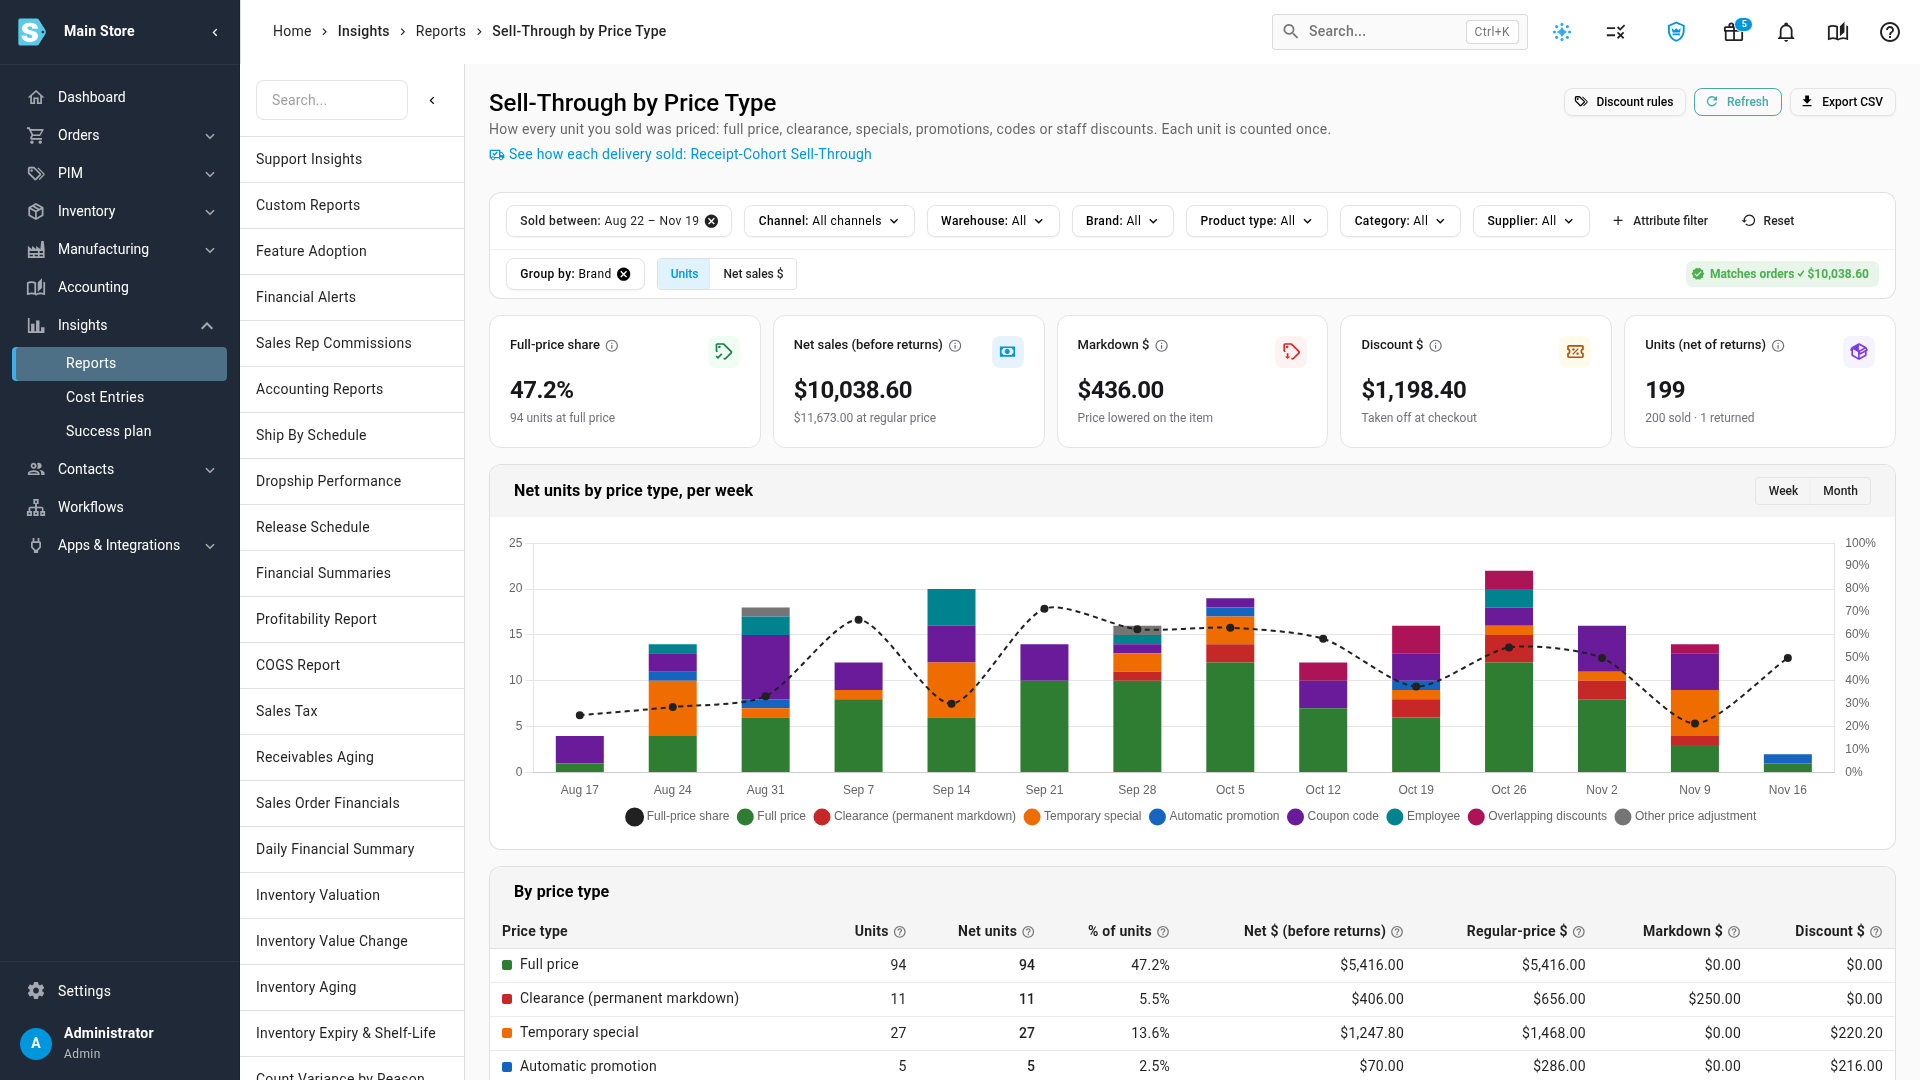
The new Sell-Through by Price Type report counts every unit you sold once, under the price it sold at: Full price, Clearance (permanent markdown), Temporary special, Automatic promotion, Coupon code, Employee, Overlapping discounts or Other price adjustment. The cards show your full-price share, the money given up to markdowns and to discounts, and a weekly or monthly chart shows the trend. Group by brand, supplier, style or any attribute, such as size or colour. Discount rules let you decide what each discount counts as, and Matches orders confirms the totals add up to your sales orders.
Follow each delivery from the day it arrived
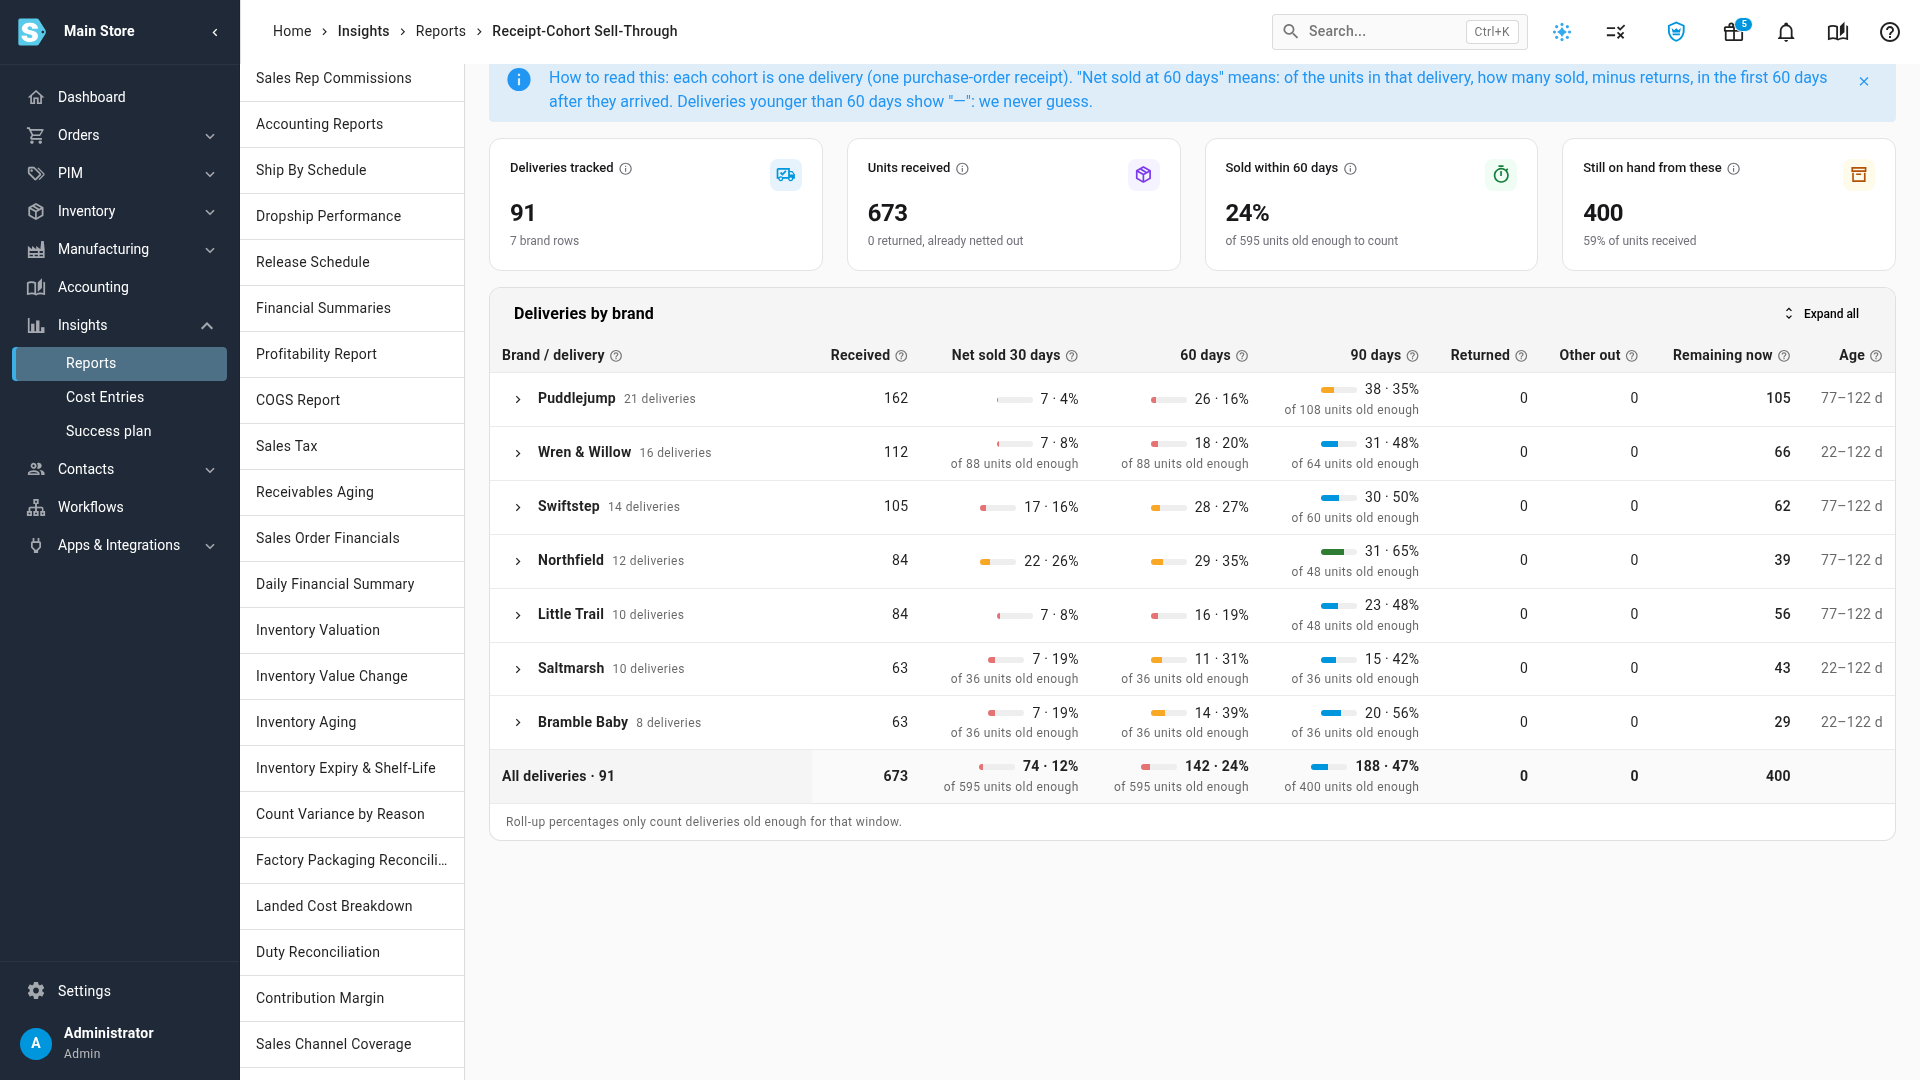
The new Receipt-Cohort Sell-Through report follows every purchase-order delivery from the day it was received. It shows how many of its units sold within 30, 60 and 90 days, minus returns, and how many are still on hand. A delivery that hasn't been in stock long enough shows a dash, never a guess. Group deliveries by purchase order, supplier, brand, style or any attribute, and see which ones sold through and which ones you over-bought.
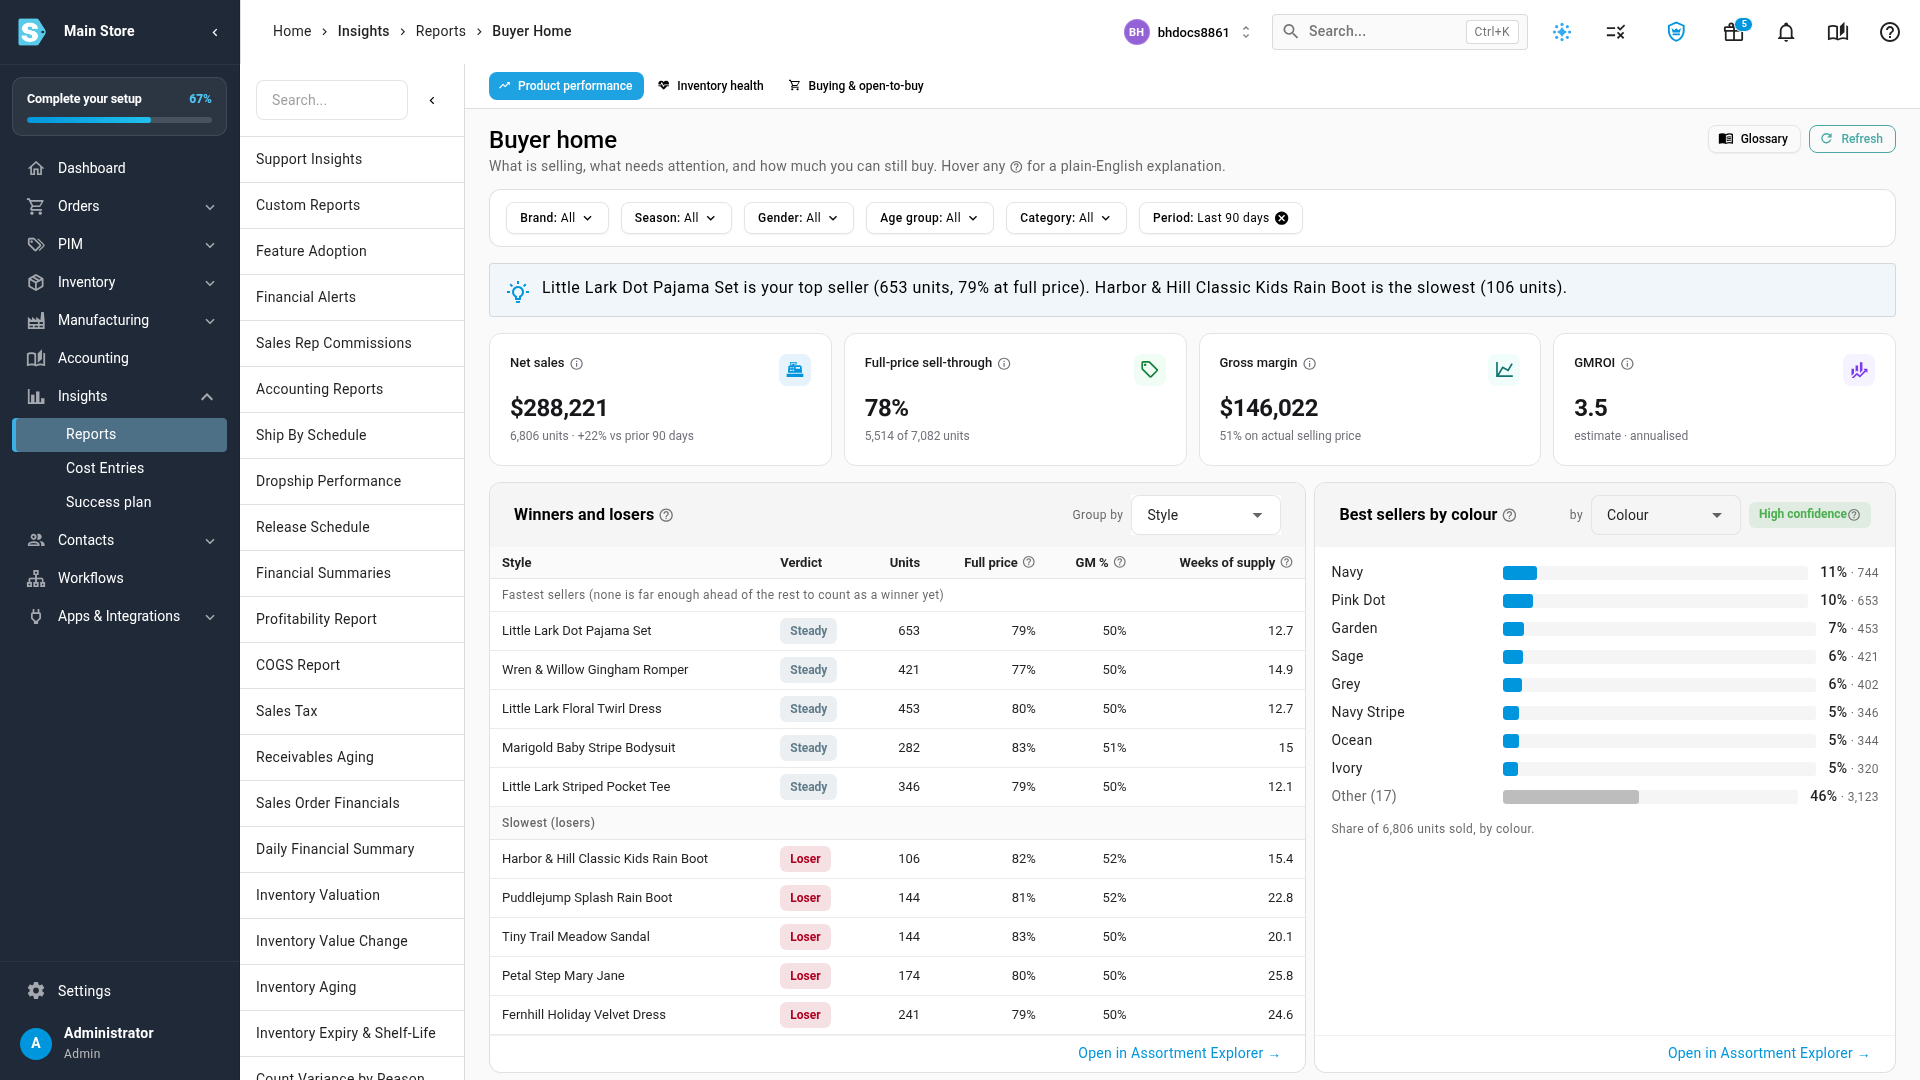
Buyer home: what's selling, what needs attention, and what you can still buy
Buyer home puts three dashboards under one set of Brand, Season, Gender, Age group, Category and Period filters, each opening with a one-line answer.
- Product performance: net sales, full-price sell-through, gross margin and GMROI, winners and losers, best sellers, and profit.
- Inventory health: estimated sales lost to stockouts, sales by discount type, sizes that sold out, returns, aging and sell-through by delivery.
- Buying & open-to-buy: set a monthly receipt budget at cost, see what your purchase orders already commit and when they arrive, and how much is left to spend.
The cards aren't fixed to one attribute: pick size, colour, print, season or any other attribute, for example in Best sellers by. Each card remembers your choice, and Open in Assortment Explorer takes you to the full rows.
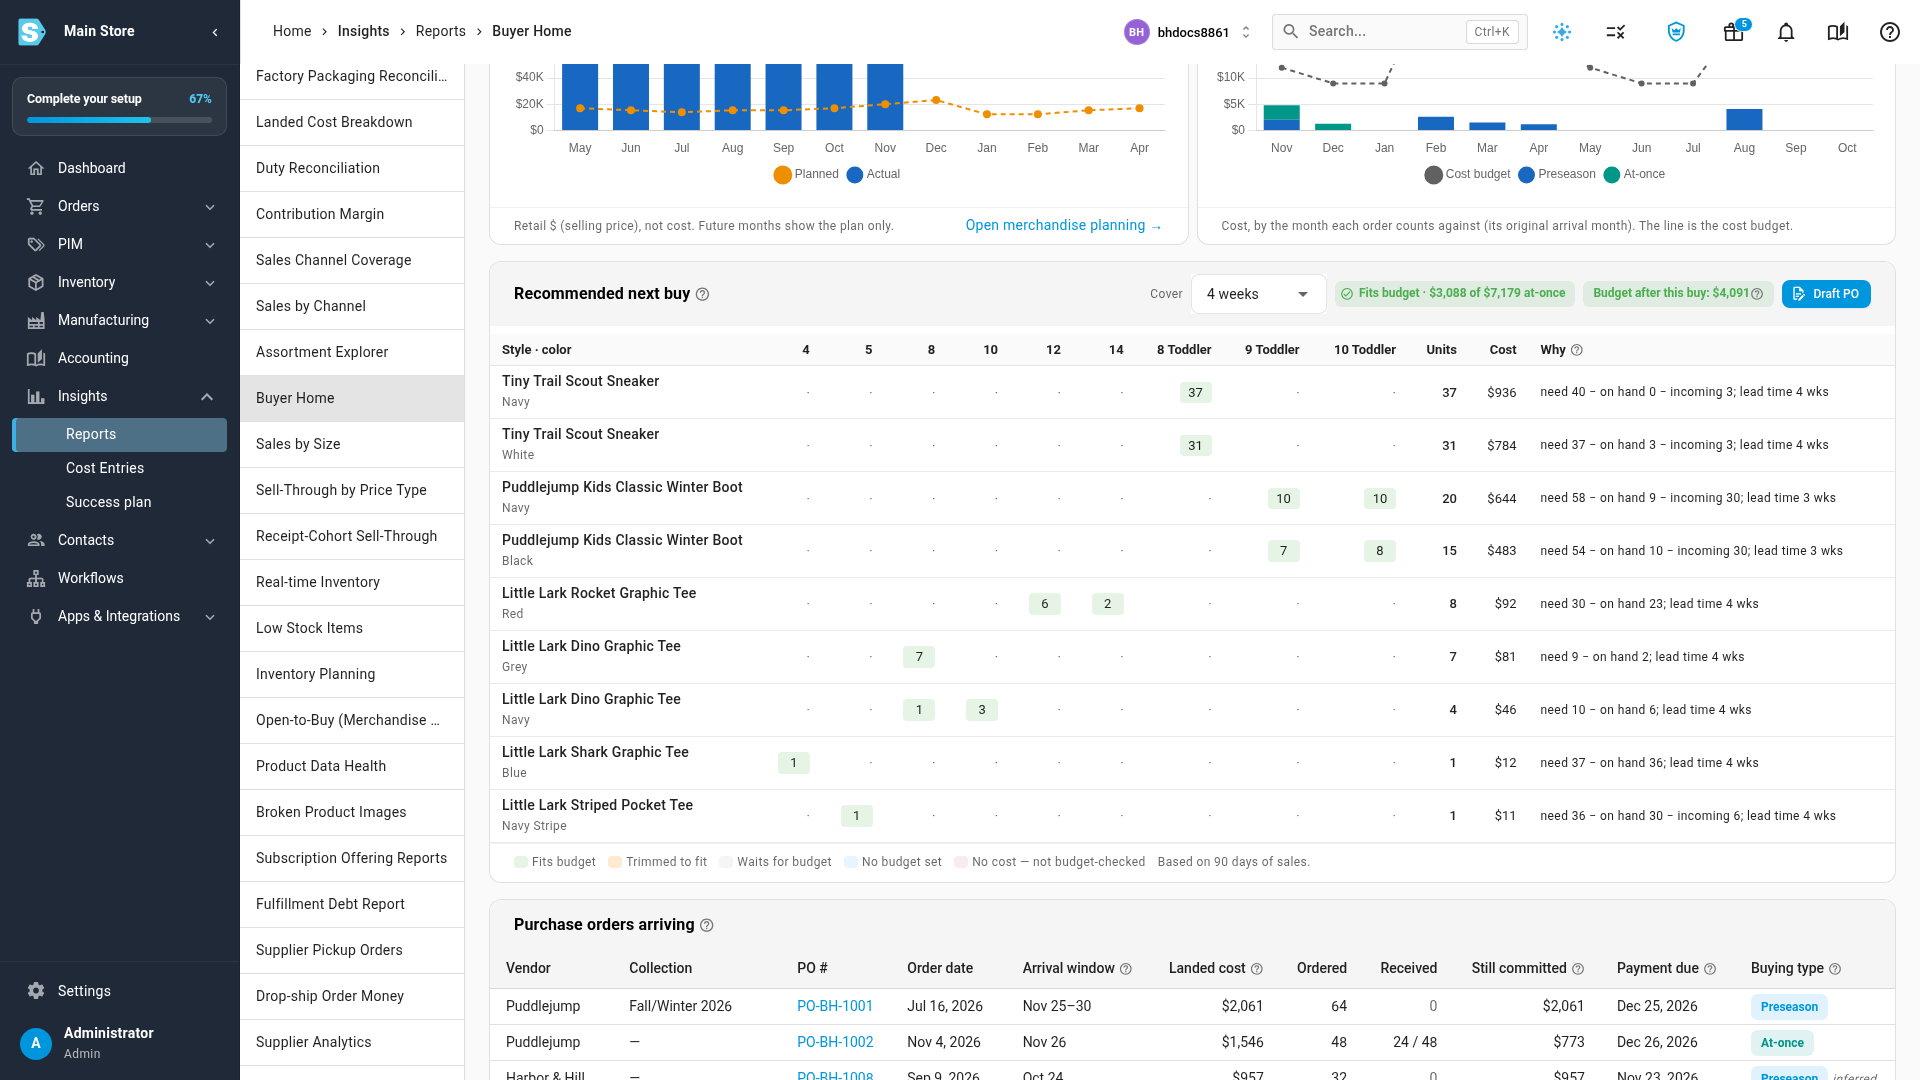
On Buying & open-to-buy, Recommended next buy suggests what to reorder now, one row per style and colour with sizes as columns. It works from how fast each size sells while it's in stock, covers the vendor's lead time plus the weeks you pick, and fills against the money you have left this month. Click Draft PO to turn it into one draft purchase order per vendor. Purchase orders also gain Buying type (preseason or at-once), Arrival window and Collection. A late delivery moves on the arrival calendar, but its cost stays in the month it was first due, so it never frees up budget you've already spent.
Where to find it
- Assortment Explorer: Insights → Reports → Assortment Explorer. Stockout and return columns are under Columns.
- Category and brand size curves: Inventory → Size Profiles → Derive from Sales.
- Sell-Through by Price Type and Receipt-Cohort Sell-Through: Insights → Reports.
- Buyer home: Insights → Reports → Buyer Home.
To open them, a role other than an administrator needs Assortment Explorer or Buyer Home turned on under Report Access.
Full guides: Find winners and losers with the Assortment Explorer, Find sizes that lose sales to stockouts, Read the Sell-Through by Price Type report, Read the Receipt-Cohort Sell-Through report, Read the Buyer home dashboards and Plan buys with open-to-buy on Buyer home.