
Weeks of Cover vs Inventory Age: Which One Shows What's Stuck?
In January I was on a call with the buying team at an apparel retailer we work with. We were there to walk through the new demand planning screens, and near the end their buying lead asked if he could share his screen. There was something he did every week that he wanted us to see.
It was a spreadsheet. “We track weeks of cover, like problem stock,” he said. “And it’s very manual process.”
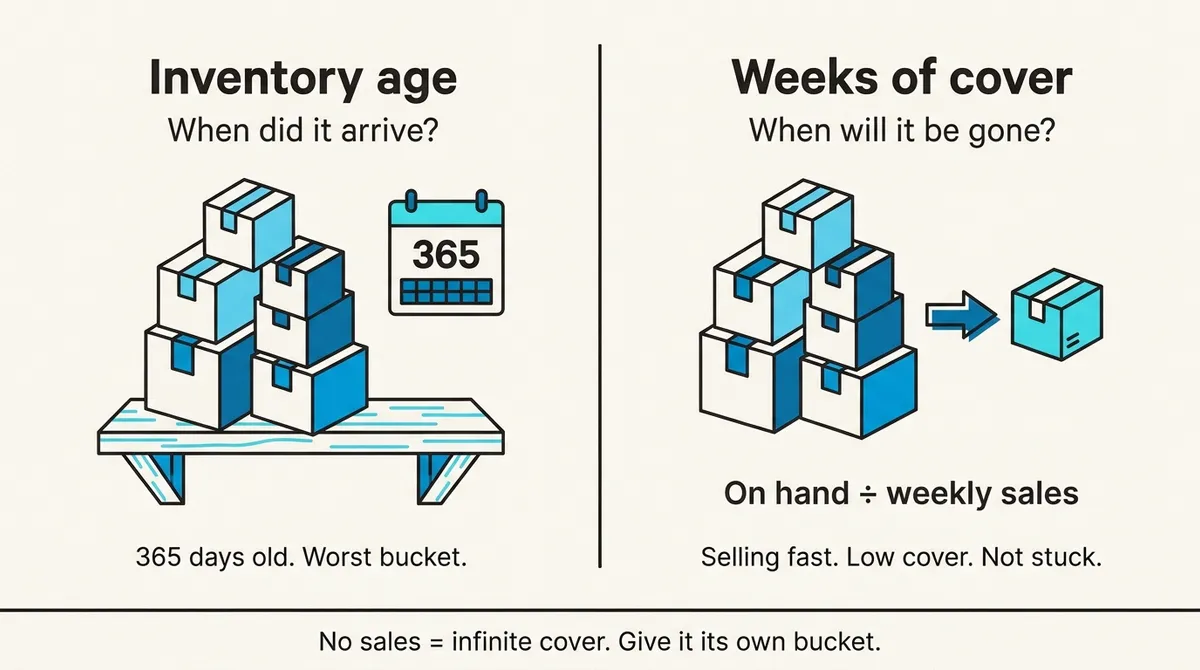
Weeks of cover is units on hand divided by what you sell in a week. He had sorted the whole catalog by it. One to twelve weeks at the top. Further down, the reds: everything over 52 weeks. Below that a group he called infinite, products with stock on the shelf and no sales in the lookback window, so there was nothing to divide by. Then he pivoted the reds every way he could think of. By vendor, by season code, by tag, by price point. “And it’s all kind of spreadsheet and manual work.”
I shared my screen back and showed him our stock coverage timeline, which I thought was close. It wasn’t. It listed individual SKUs at 20 days, 15 days, 10 days, with no summary on top, and it cut off partway down the zero-coverage end because it had never been built for that many rows. I said so. It was meant to inspire, not to be the final version.
So I pulled up the inventory aging report instead, which buckets stock by how long it has sat. One of his colleagues said that was exactly what he’d asked for on an earlier call.
He didn’t agree. “Stock age can be misleading,” he said.
“Is it?” I said, and then worked it out loud while he waited. Say some units are 365 days old. Aging puts them in the worst bucket. But if you’re heavily stocked on something that sells quickly, the oldest units can be a year old while the product moves fast, and the cover is low.
“You’re not really worried about being stuck with this forever,” he said. Which was his point, and he put it better than I had. Aging tells you when the stock came in. A buyer deciding what to mark down wants to know how long it will take to leave.
Then I gave him the advice I’d give anyone. Filter it by brand, “and you could also export it and pivot table it.” Then, “That’s what we do.”
I meant that. I like pivot tables. But it meant his week stayed the same: pull the export, paste it in, check the formulas still pointed at the right columns, rebuild the pivots. The buckets lived in his formulas and nowhere else. Earlier in the call he’d mentioned doing reorders by spreadsheet nine years before, typing quantities in off the sales trend. He’d been doing some version of this rebuild for a long time.
If you carry a few dozen SKUs and do the buying yourself, you know which ones are slow and you don’t need any of this. His catalog was well past that.
Where it got to
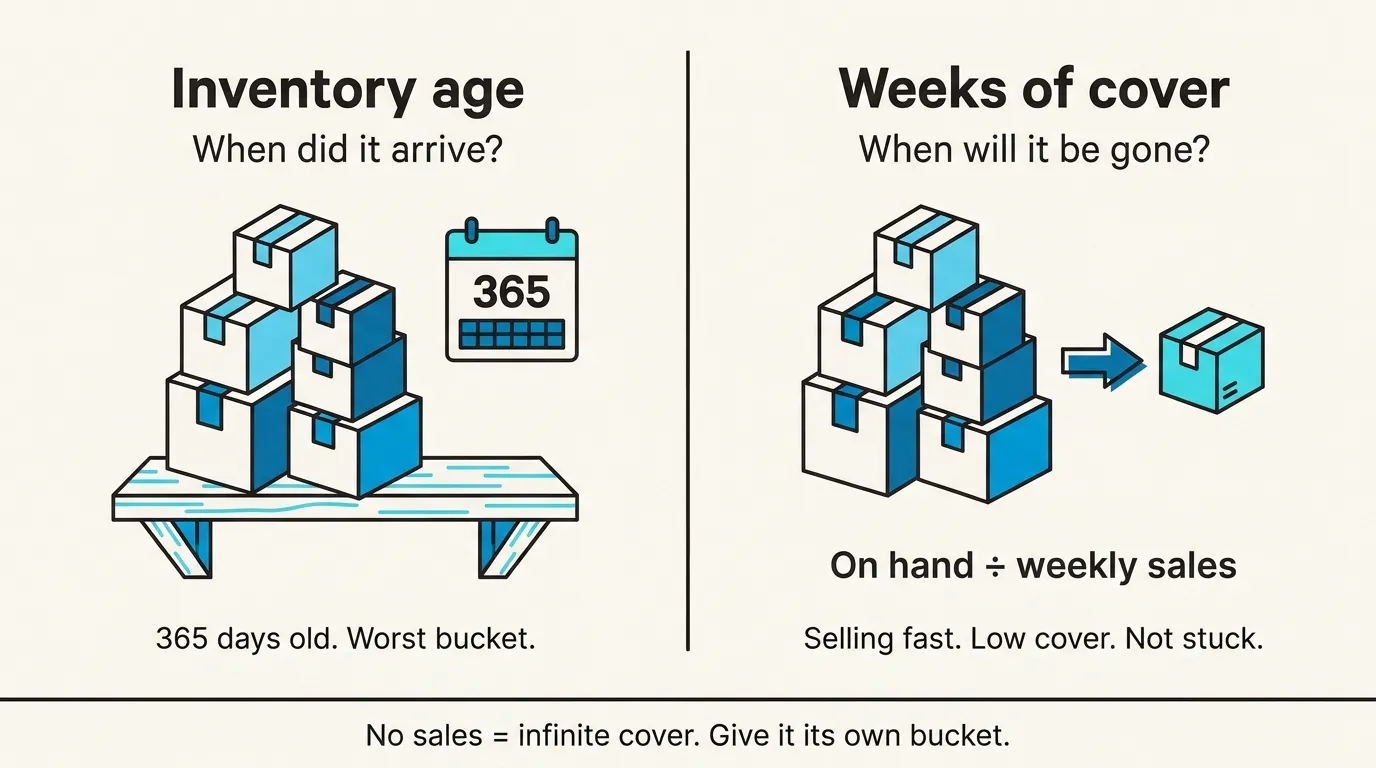
The Inventory Planning report went out in March and covers the whole catalog. Its Days of Stock column is available units over the daily sales rate, so divide by seven for his weeks. I’d keep it on available rather than adding inbound purchase orders, because with inbound in you’re asking when you run out, which is a reorder question. A product with no sales gets a blank there and a dead stock flag if nothing has sold in 90 days, which is roughly his infinite bucket. His reds are a filter, Days of Stock above 364, and that filter can be saved and sent as an XLSX every week, so the pivot sheet at least starts from the same numbers. I wrote separately about what to do with dead stock once you’ve found it.
It still isn’t his view. He wanted every bucket summarized first, then a drill-down into which vendors fill each one. I agreed on the call that summary first was right, and today it’s one filter at a time. He also asked whether stock could be valued by weeks of cover instead of by age bracket. I said I wasn’t sure when we’d get to that. We haven’t.
If you want to see where your own catalog lands, book a demo.