
Free reorder point template
A reorder point sheet with safety stock built in
One row per SKU. Type in how fast it sells and how long a delivery takes, and the sheet works out safety stock, the reorder point and how much to order, and flags every SKU that needs a PO today. Try it right here.
- Free, no email, no sign-up
- Opens in Excel, Google Sheets and Numbers
- The math is built in
Fill it in here, or download it
Reorder point sheet, with the reasons for each part
Type over the underlined parts and print it or save it as a PDF. Or download the Excel file, which has the same layout and formulas plus room for more lines.
Swipe the sheet sideways to see all of it.
-
How fast it sells
Units sold in the last 90 days ÷ 90. Peak is your busiest normal day in that window. Leave a one-off promotion out.
-
How long the next one takes
Days from sending the PO to stock you can sell, not to the ship date. Transit, customs, receiving and putaway all count.
-
Safety stock you can defend
Peak × worst lead time, minus average × normal lead time. No statistics, and every unit traces back to a slow delivery or a busy day.
-
Count what is already on order
Compare the reorder point with on hand plus open POs. Otherwise the SKU you reordered last week gets ordered twice.
-
How much to order
Enough to get back to the reorder point plus the days of cover you want. The row turns red when it is time.
Run this in SKU.io
Let the forecast set the reorder point
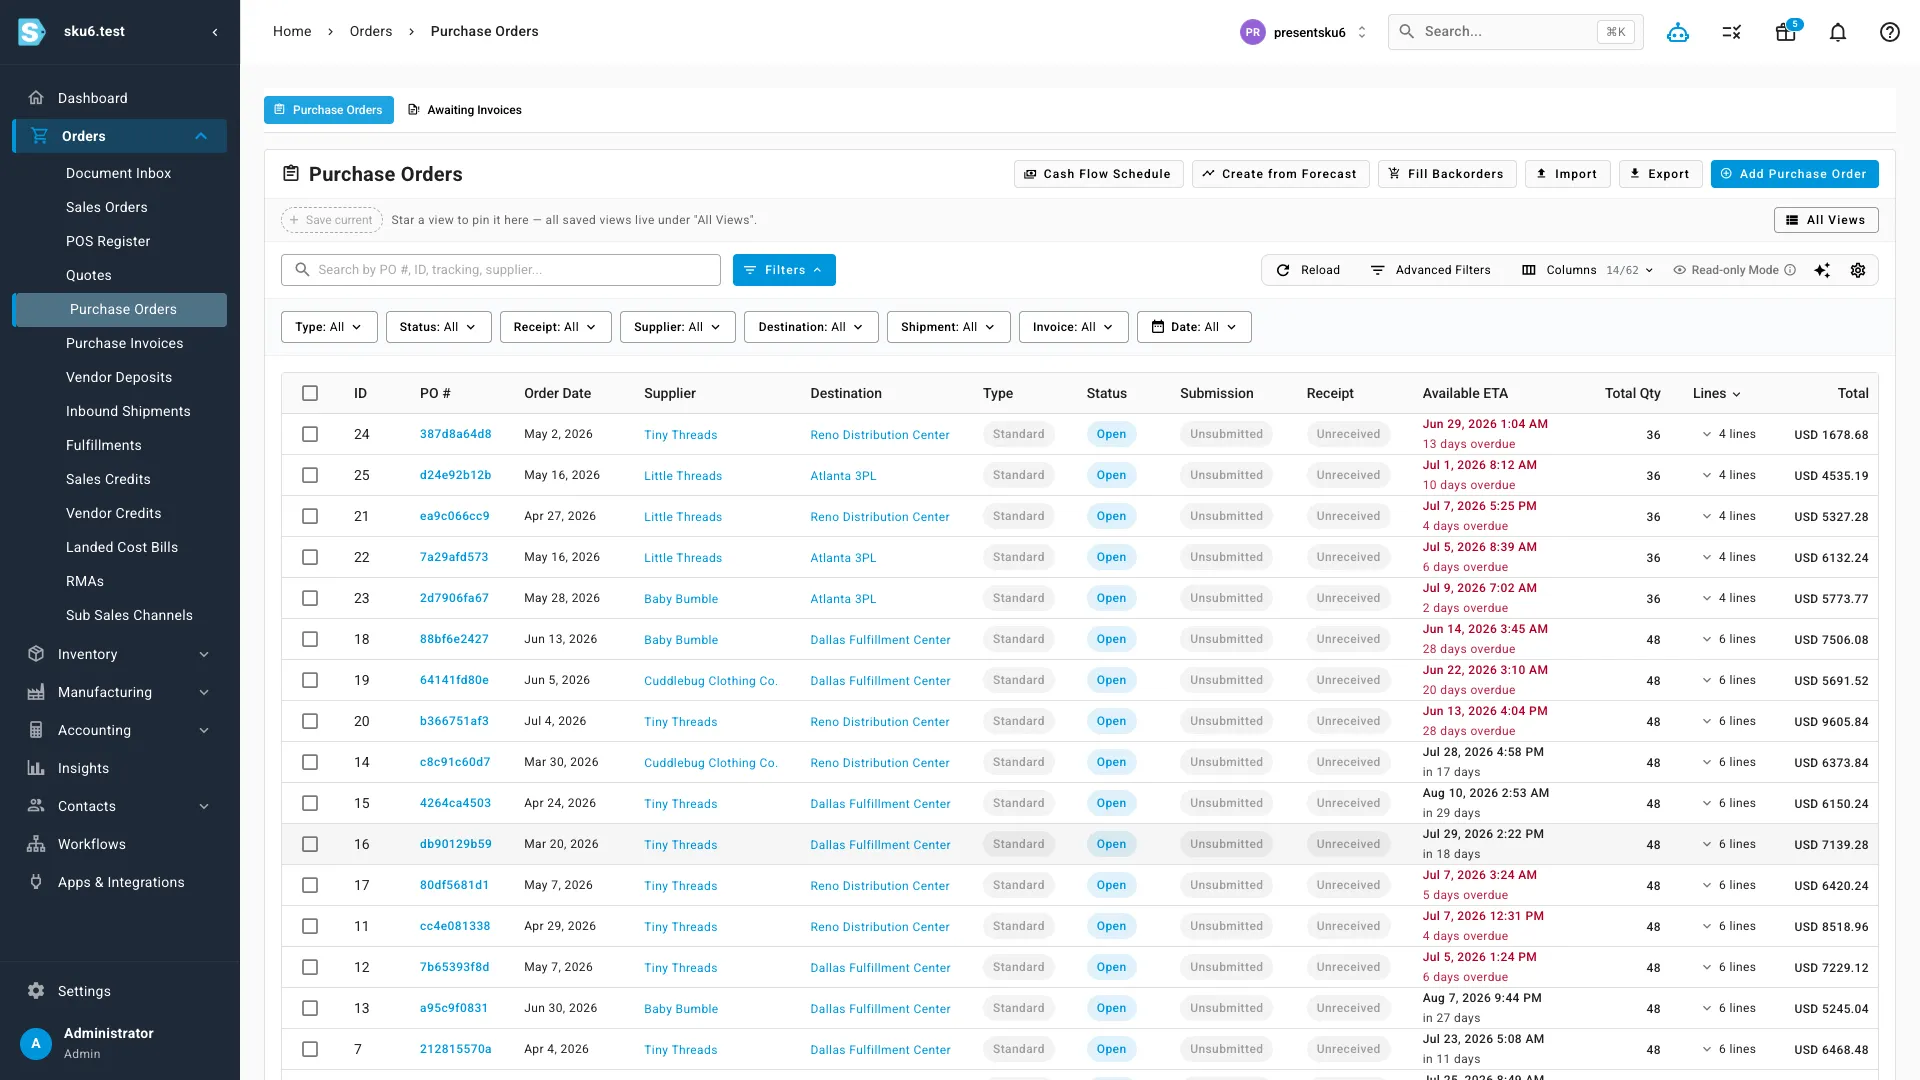
SKU.io forecasts each SKU with trend, seasonality and past promotions, shows a confidence range and the reasoning behind every number, and turns the suggested quantities into purchase orders in bulk.
| In the spreadsheet | In SKU.io |
|---|---|
| One 90-day average for the whole year | Trend and seasonality per SKU |
| Sales added up by hand across channels | Every channel feeds one stock pool |
| A YES in a column | A suggested quantity with its reasoning |
| Copy the quantities into a PO | Create from Forecast builds the POs |
Do this once by hand before you buy anything
Running out of stock is why sku.io exists. I started building it over ten years ago for my own store, because I did not want to run out and I wanted to know what my stock was worth. Before that, my office manager kept the reorder numbers in a spreadsheet, filling in how many days of cover we had for each product, by hand.
That sheet taught me what a reorder point is made of, and it is only two numbers: how fast a SKU sells and how long the next delivery takes. Everything else is cushion. Write those two numbers down per SKU in this sheet, because any software will ask you for them anyway.
Where a reorder point sheet breaks
Seasonal SKUs, because a 90-day average in spring under-orders for the holidays. One stock pool sold on several channels, because the sales rate is the sum of every channel. And bundles, which use up component stock the sheet cannot see. That is where I moved my own buying to a forecast. These days I let it draft the POs and then adjust:
"I look at the forecasting, it gives me all the POs, I click one button to create the POs and then I kind of like gut it and say, okay, I'm going to increase this, this, this and this by like 10 or 20% just because I know that things are growing."
The judgment stays with you. The arithmetic does not have to. If your POs still live in a spreadsheet, the purchase order template matches this sheet's columns.
Questions people ask
What is the reorder point formula?
Reorder point = average daily sales × lead time in days + safety stock. When the stock you have plus what is already on order falls to that number, place the next purchase order.
How is safety stock calculated in this sheet?
With the max-minus-average method: (maximum daily sales × maximum lead time) − (average daily sales × average lead time). It needs no statistics, only your busiest normal day and your slowest delivery.
What lead time should I use?
Days from sending the purchase order to the stock being sellable, not to the ship date. Include transit, customs, receiving and putaway. For the maximum, use your slowest delivery in the last year.
How much should I order when a SKU hits its reorder point?
The sheet suggests enough to get back to the reorder point plus the days of sales you enter as cover. With 14 units a day and 90 days of cover, that is the reorder point plus 1,260 units, minus what you already have available.
When does a reorder point sheet stop working?
For seasonal SKUs, where an average hides the peak; for one stock pool sold on several channels; and for bundles that use up component stock. Those need a forecast rather than a fixed average.
Bring your reorder sheet to a call
Bring the sheet and the SKUs that ran out last quarter. We will run the same SKUs through the SKU.io forecast and compare.
Book a DemoFounder-led demo · 2-day onboarding · no onboarding fees