Support Insights — see where your team gets stuck, and why
Every support ticket tells you something: a screen that confuses people, a setting nobody understands, an integration that keeps tripping up. Spread across a year of conversations, though, the pattern is hard to see, and you usually have to ask us for a summary. Support Insights lets you build that summary yourself. Pick a date range and SKU.io produces a report that crosses three things: what your team asks us about, which parts of SKU.io you actually use, and how our servers performed over the same period. The result is a short, ranked list of findings that says where the pain is and whether it's on our side or yours.
✨ What this means for you:
- Answers, not just counts. The report opens with ranked findings in plain sentences, each one tagged as being on us, on you, or both.
- Pain matched to usage. A feature that causes lots of tickets but sees little use stands out right away. So do features in your plan that you've never used.
- Ticket spikes explained. Every busy week is checked against server availability, so you know whether downtime was behind it.
- The same answer every time. No AI writes the report. Every number comes from fixed rules, so the same data always produces the same report.
- Your data, your AI. Download the data as JSON, or read it through the API, and give it to your own AI assistant under your own policies.
Findings first
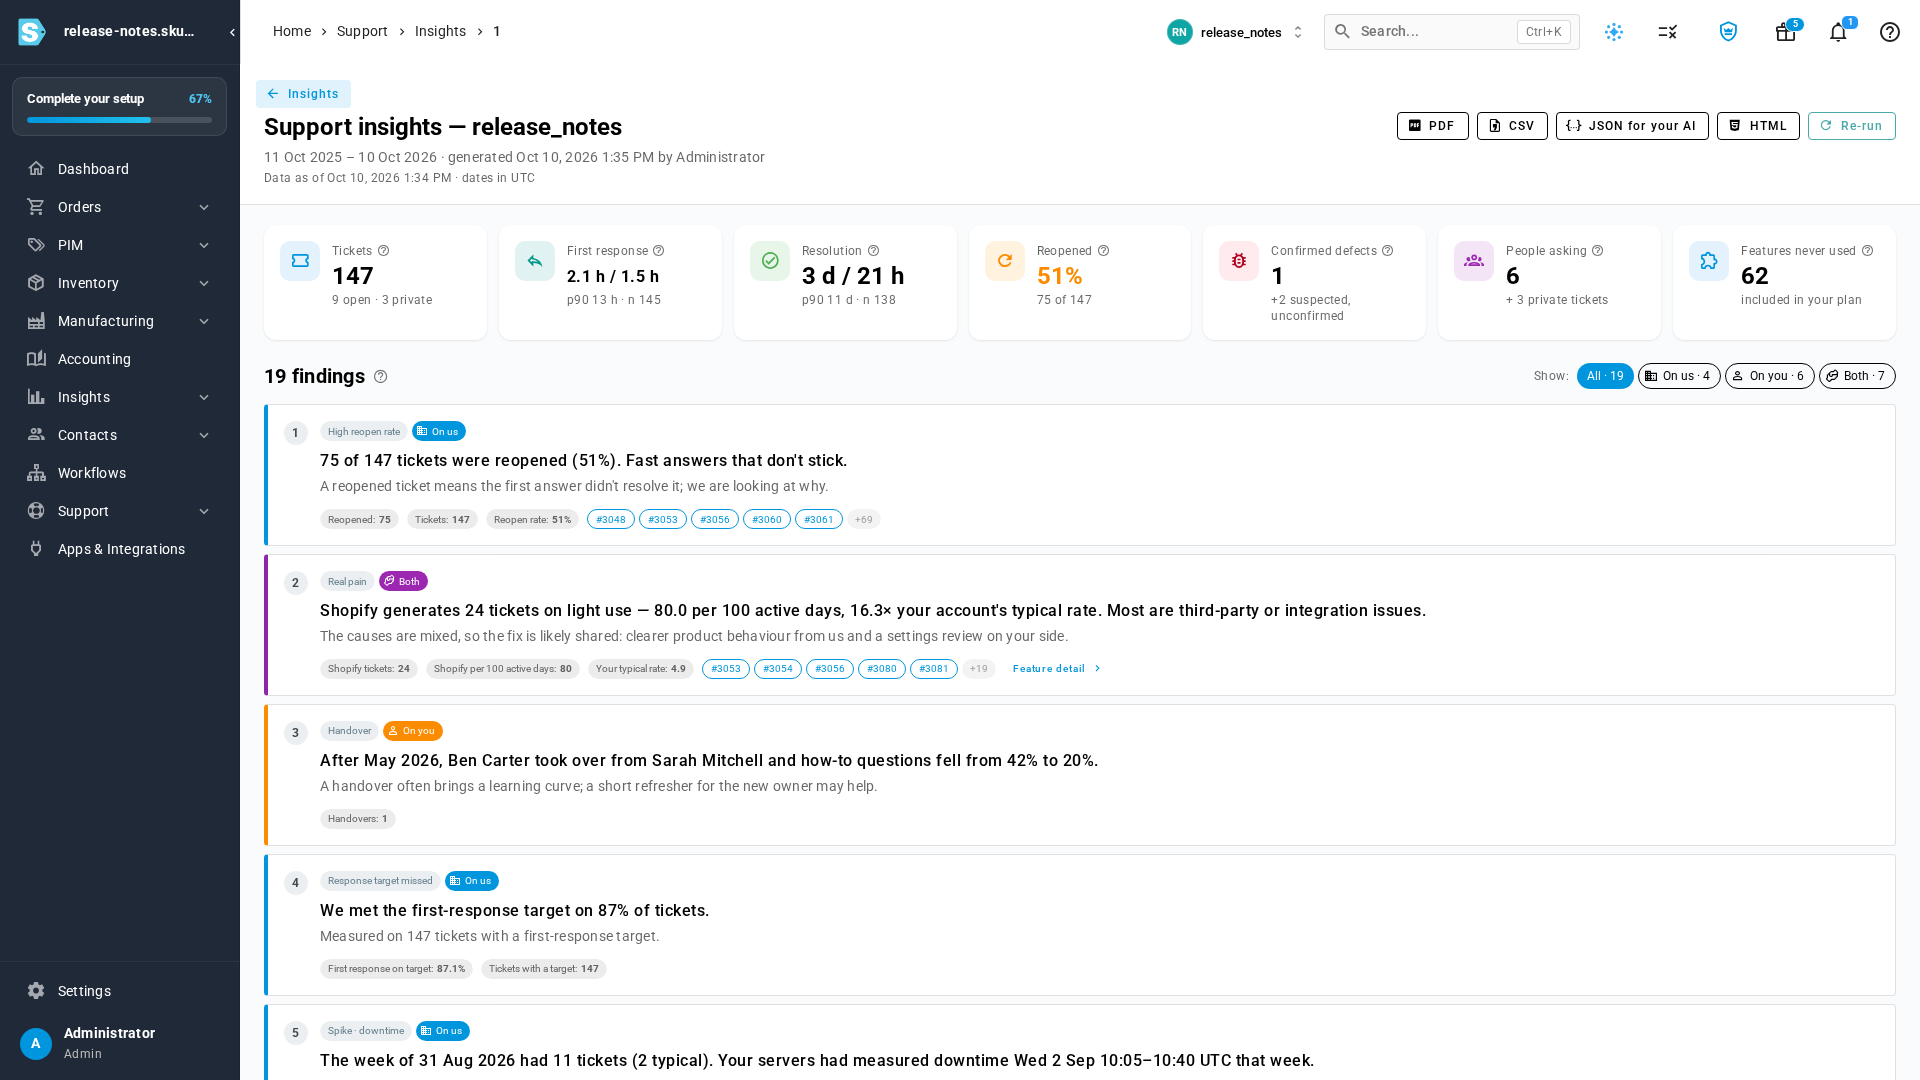
Open Support → Insights, choose a range (the last 90 days, 6 months, 12 months, all history or custom dates) and select Generate report. A few seconds later the report opens with a summary of your tickets, response and resolution times, reopen rate and confirmed defects, followed by its findings in priority order. Each finding names the tickets behind it, so you can click straight through to the conversations.
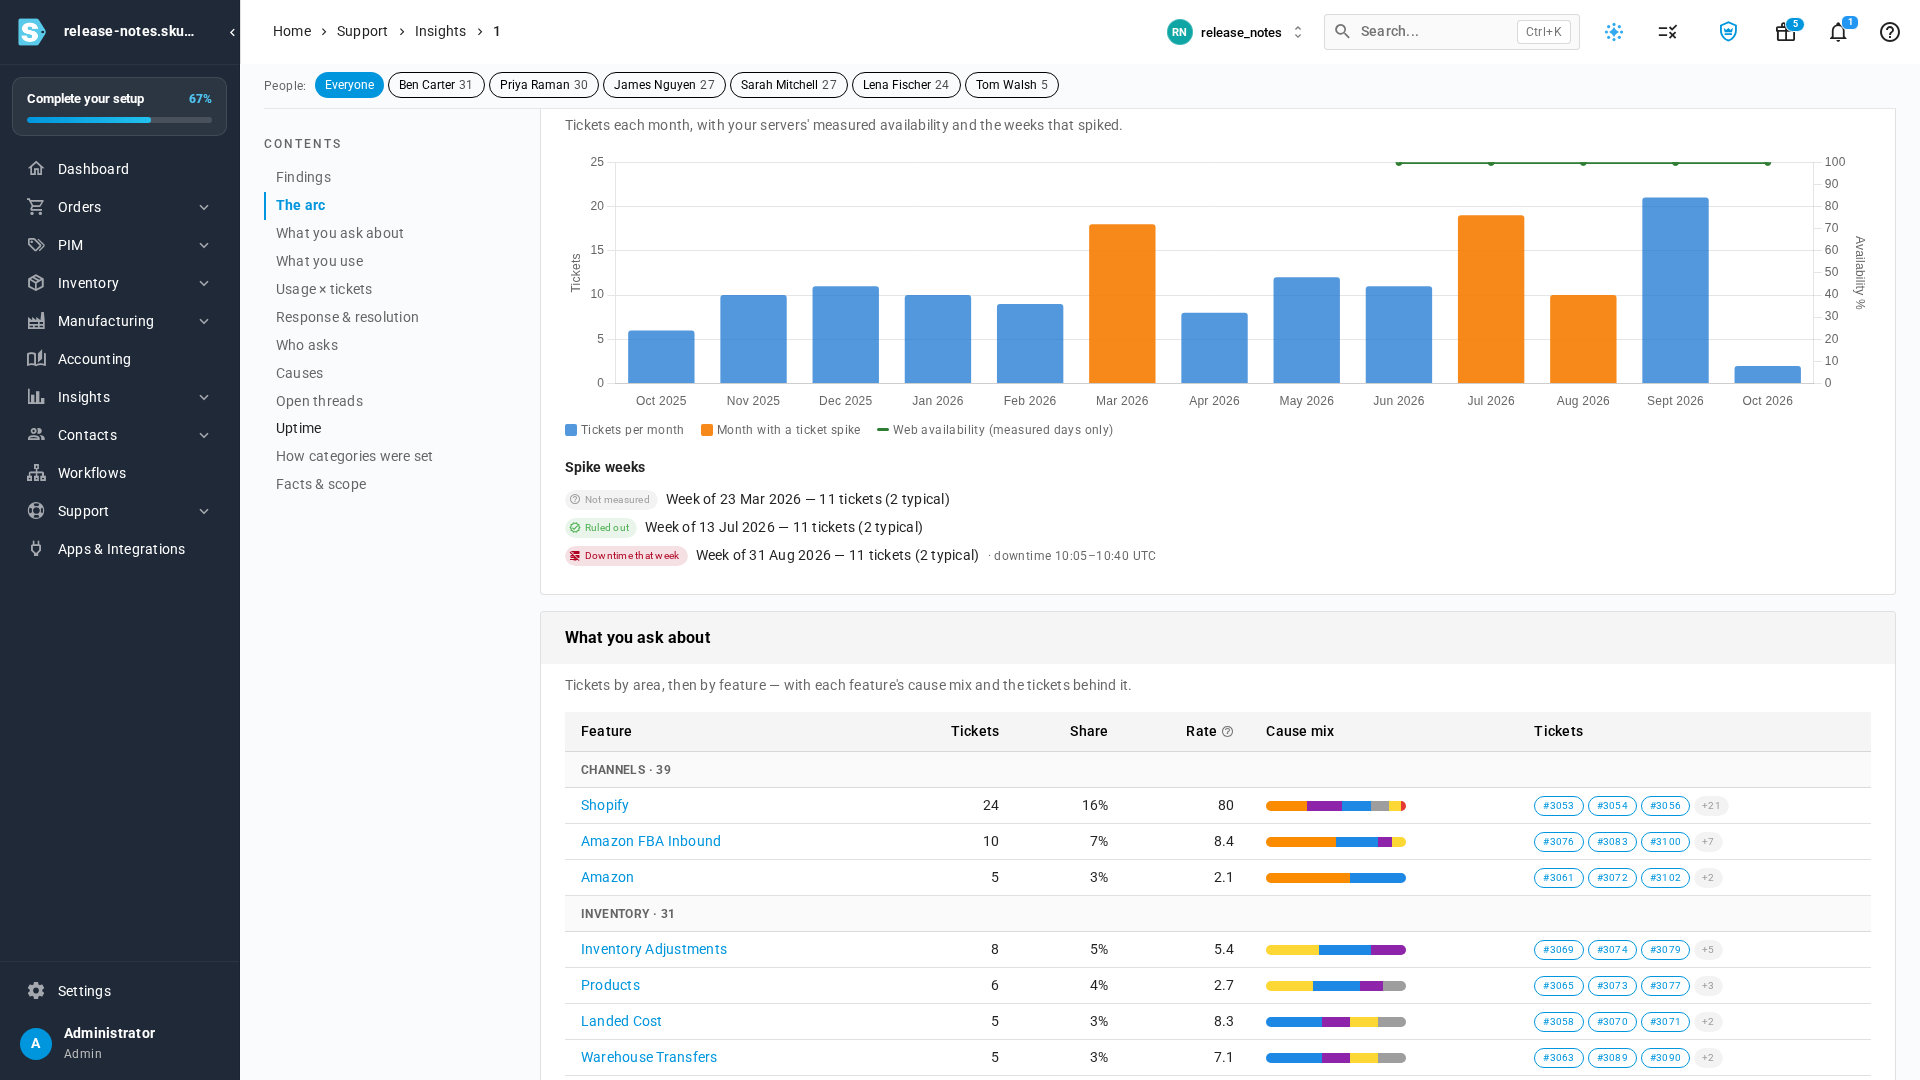
The arc of your year
A month-by-month chart shows how many tickets your team raised, with busy months highlighted and our measured availability laid over the top. Underneath, every spike week gets a verdict: there was downtime that week, downtime was ruled out, or the week falls outside the period we measured.
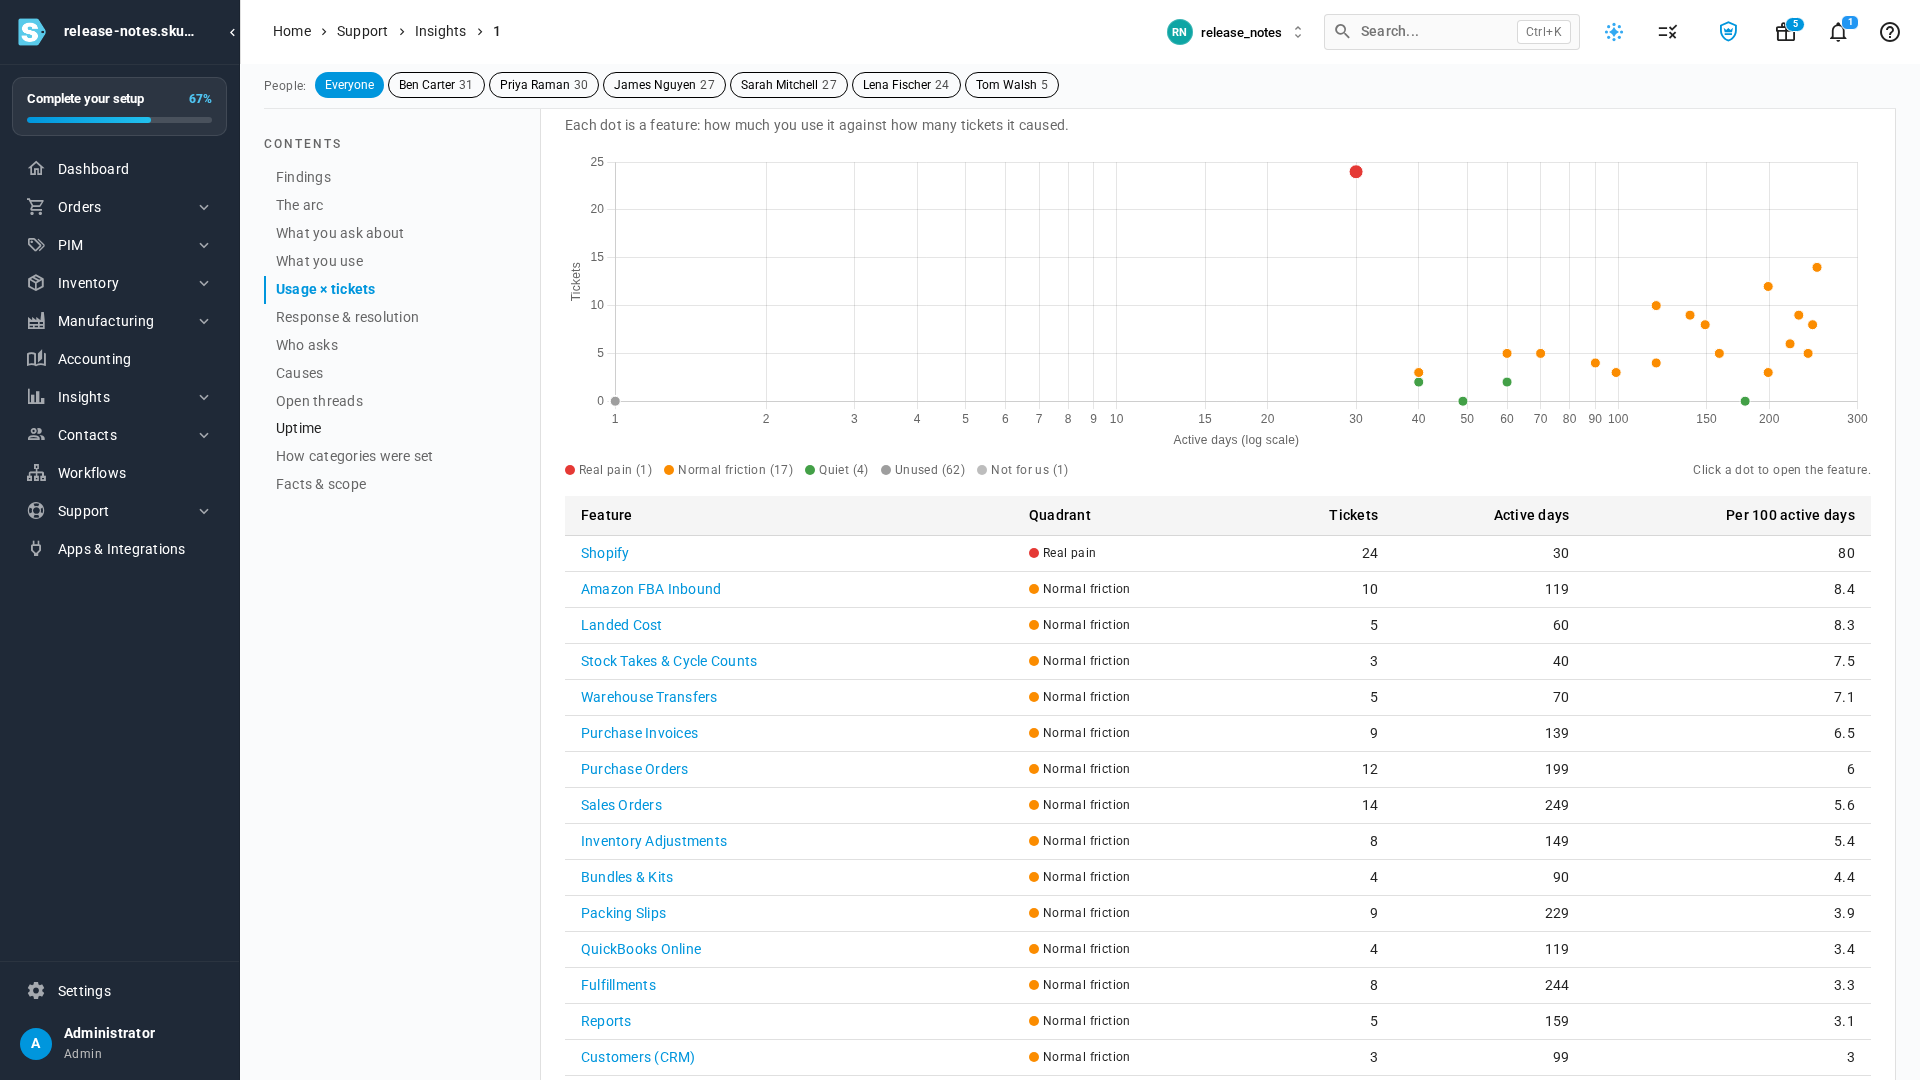
Usage against tickets
Each feature is plotted by how much you use it against how many tickets it caused. That separates normal friction on features you use every day from real pain on features you barely touch. Click any feature to see its tickets, what caused them and who asked. You can also narrow the whole report to one person on your team with the People filter at the top.
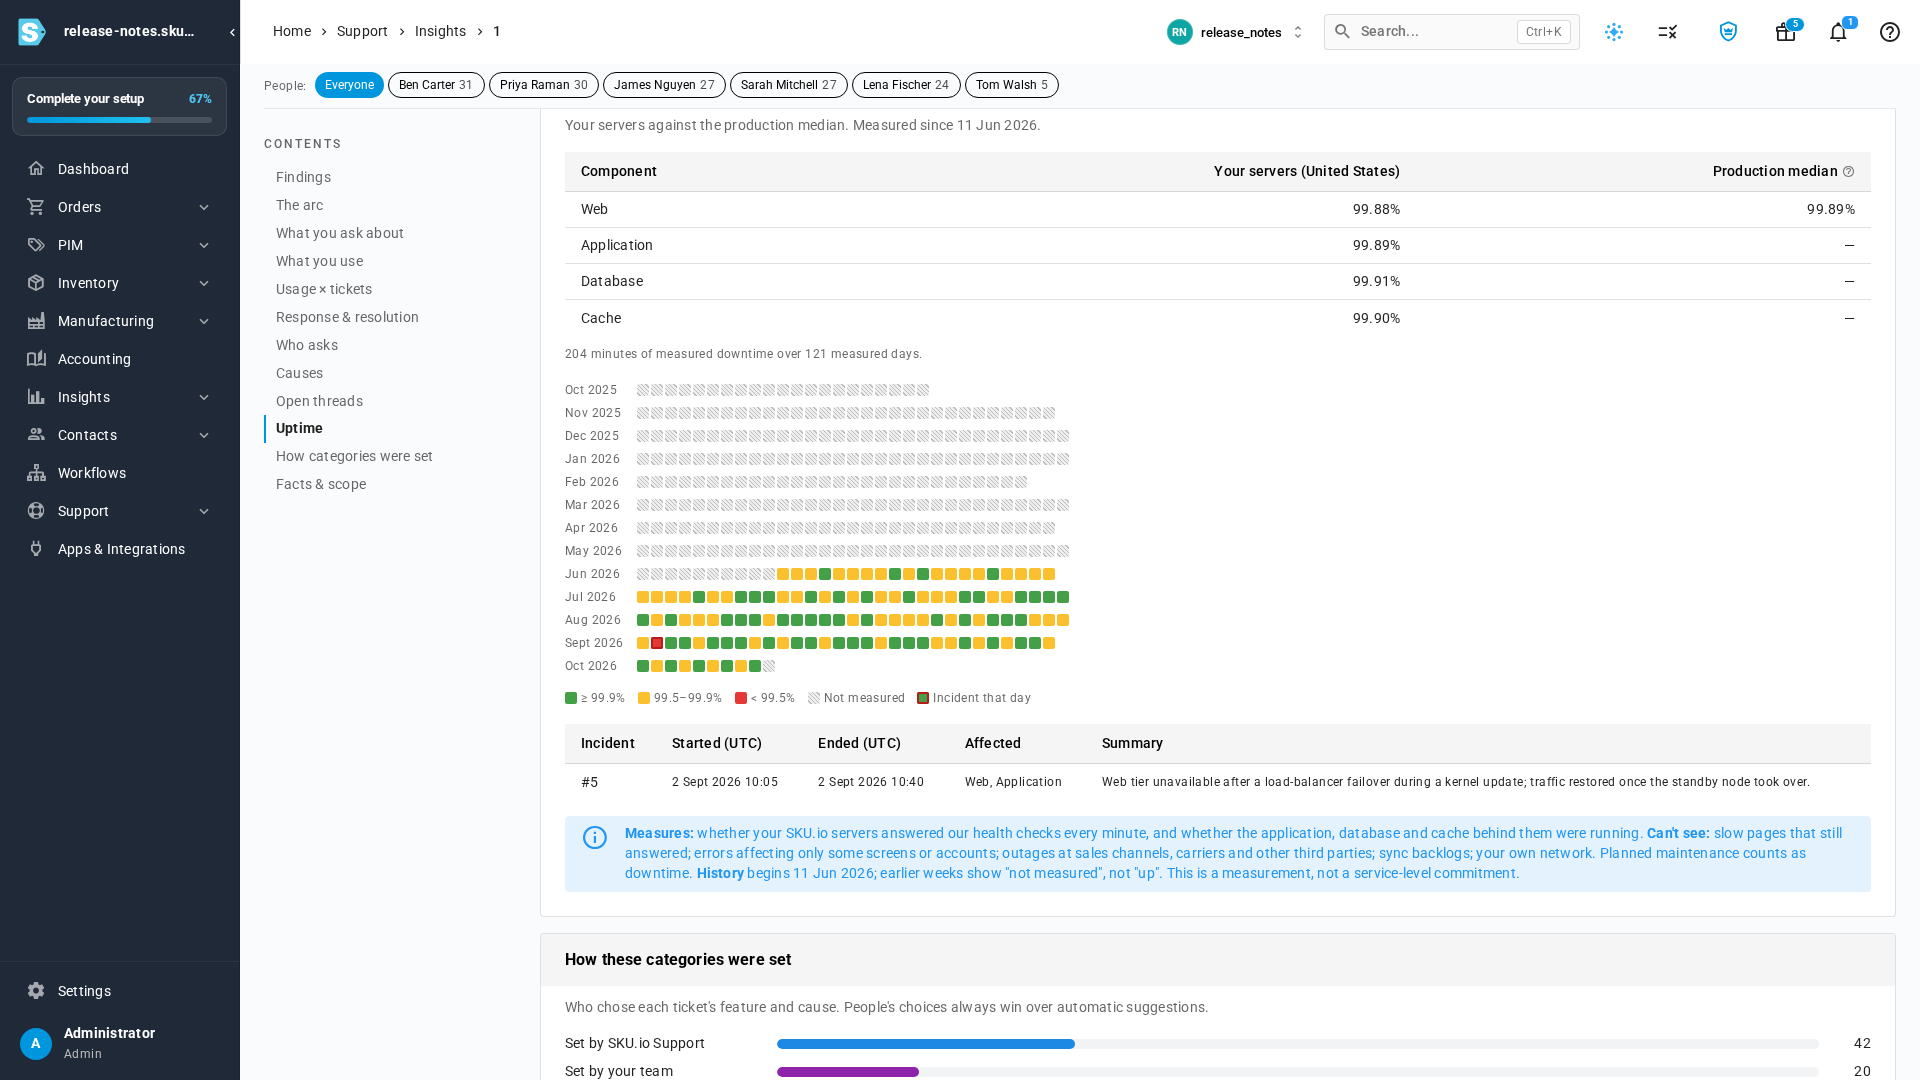
Uptime, measured honestly
The uptime section compares your servers against the production median and shows a day-by-day calendar with any incidents. A note under the calendar says exactly what the measurement covers and what it can't see, such as problems at your sales channels or carriers.
Categories you can see and correct
Every ticket now shows which feature it was about and what caused it, such as a how-to question, a setting or a defect. If a category looks wrong, select Not right? on the ticket to correct it. Your correction is recorded on the ticket's timeline and is used in your next report.
Take it with you
Download any report as PDF, CSV or HTML, or select JSON for your AI. The JSON download includes a field guide and a ready-made prompt, so you can paste it into your own AI assistant and ask follow-up questions. The same data is available through the SKU.io API and the SKU.io MCP server. Reports are saved, so you can come back to them, run them again with today's data, or delete them.
Where to find it
Go to Support → Insights. Reports show who on your team raises which tickets, so only admins can open them at first. An admin can give other roles access in Settings → Roles by turning on the Support insights permission.