Read an ASIN's daily data
A brand report sums up a period. When a number in it needs explaining, such as a sales drop or a lost Buy Box, the ASIN data page shows the same ASIN one day at a time: Amazon's sales and traffic for the listing, plus the day's sales rank, offers, Buy Box and MAP status. You can download it as a CSV to send to the brand.
Before you begin
- The brand must have brand reporting set up on an Amazon channel.
- Sales and traffic come from Amazon's Brand Analytics, which needs the Brand Analytics role on the Amazon seller account. Without it, Amazon sends no sales and traffic and the page has no rows.
- Data arrives nightly. History fills in from the day brand reporting was turned on.
Open an ASIN's daily data
You reach the page from an ASIN, in either of these places:
-
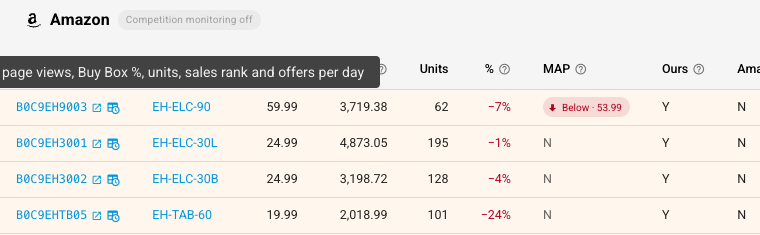
In a brand report. Go to Insights → Reports → Brand Reports, open a report, and in a channel's table click the table-and-clock icon next to the ASIN. Its tooltip reads "Daily data — sessions, page views, Buy Box %, units, sales rank and offers per day". The page opens on the report's period.
-
In a brand's watched ASINs. On the brand's reporting settings, right-click an ASIN and choose View Daily Data.
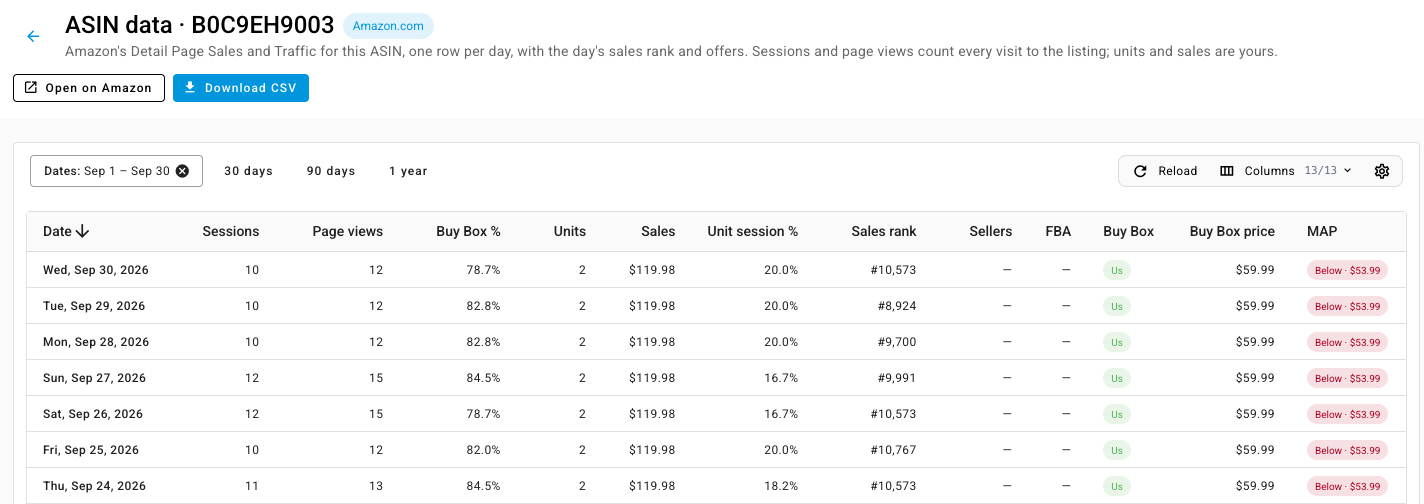
The page is titled ASIN data, followed by the ASIN and the Amazon marketplace, such as Amazon.com.
Choose the dates
- Use Dates to pick a range, or click 30 days, 90 days or 1 year.
- If the table says No data for these dates, widen the range. Data only goes back to when brand reporting was turned on.
Read the columns
Each row is one day, newest first.
| Column | Means |
|---|---|
| Date | The day. |
| Sessions, Page views | Visits to the listing on Amazon that day, from every shopper, whoever they bought from. |
| Buy Box % | The share of page views where your offer held the Buy Box. |
| Units, Sales | What you sold through this listing that day. |
| Unit session % | Units ordered as a share of sessions: how often a visit turned into a sale. |
| Sales rank | The day's best-seller rank, such as #10,573. Lower is better. |
| Sellers | How many sellers had an offer on the ASIN. A + means there were at least that many. |
| FBA | How many of those offers were fulfilled by Amazon. |
| Buy Box | Who held the Buy Box: Us, Amazon, or another seller's ID. Click a seller ID to open their storefront. |
| Buy Box price | The price of the winning offer. |
| MAP | OK when every offer was at or above the brand's minimum advertised price. Below, with the lowest price, when an offer went under it. A dash means there's no MAP to check against. |
A dash in any other column means Amazon reported nothing for that day.
Download or open the listing
- Download CSV saves the rows for the dates you've chosen. It's unavailable when there's nothing in the range to download, and its tooltip says so.
- Open on Amazon opens the product page on the marketplace.
- When the ASIN is linked to one of your products, its SKU appears next to the title. Click it to open the product.
The page opens inside Insights → Reports, with the reports list beside it. Use the back arrow beside the title to return to the report or settings page you came from, or Brand Reports in the breadcrumb to go to the list of brand reports.
Next steps
- Review a brand report: the report the ASIN came from.
- Set MAP prices: the prices the MAP column checks against.
- Brand alerts: be told about MAP breaks and lost Buy Boxes as they happen.