Read the Buyer home dashboards
Buyer home puts a buyer's three questions on one page: what is selling, what needs attention, and how much you can still buy. This guide covers the first two tabs, Product performance and Inventory health. The third tab, Buying & open-to-buy, has its own guide: Plan buys with open-to-buy on Buyer home.
Before you begin
- Your products carry a brand, a category and the attributes you buy by, such as Size, Colour, Season, Gender and Age group. A filter or picker for an attribute your store doesn't have is greyed out, with a note saying why.
- You can open reports. Admins and anyone who can view all reports can, or give a role Buyer Home under Report Access.
Steps
- Go to Insights → Reports and choose Buyer Home. It opens on the Product performance tab.
- Read the one-line answer at the top. It sums up the cards below it, for example your top seller and your slowest style.
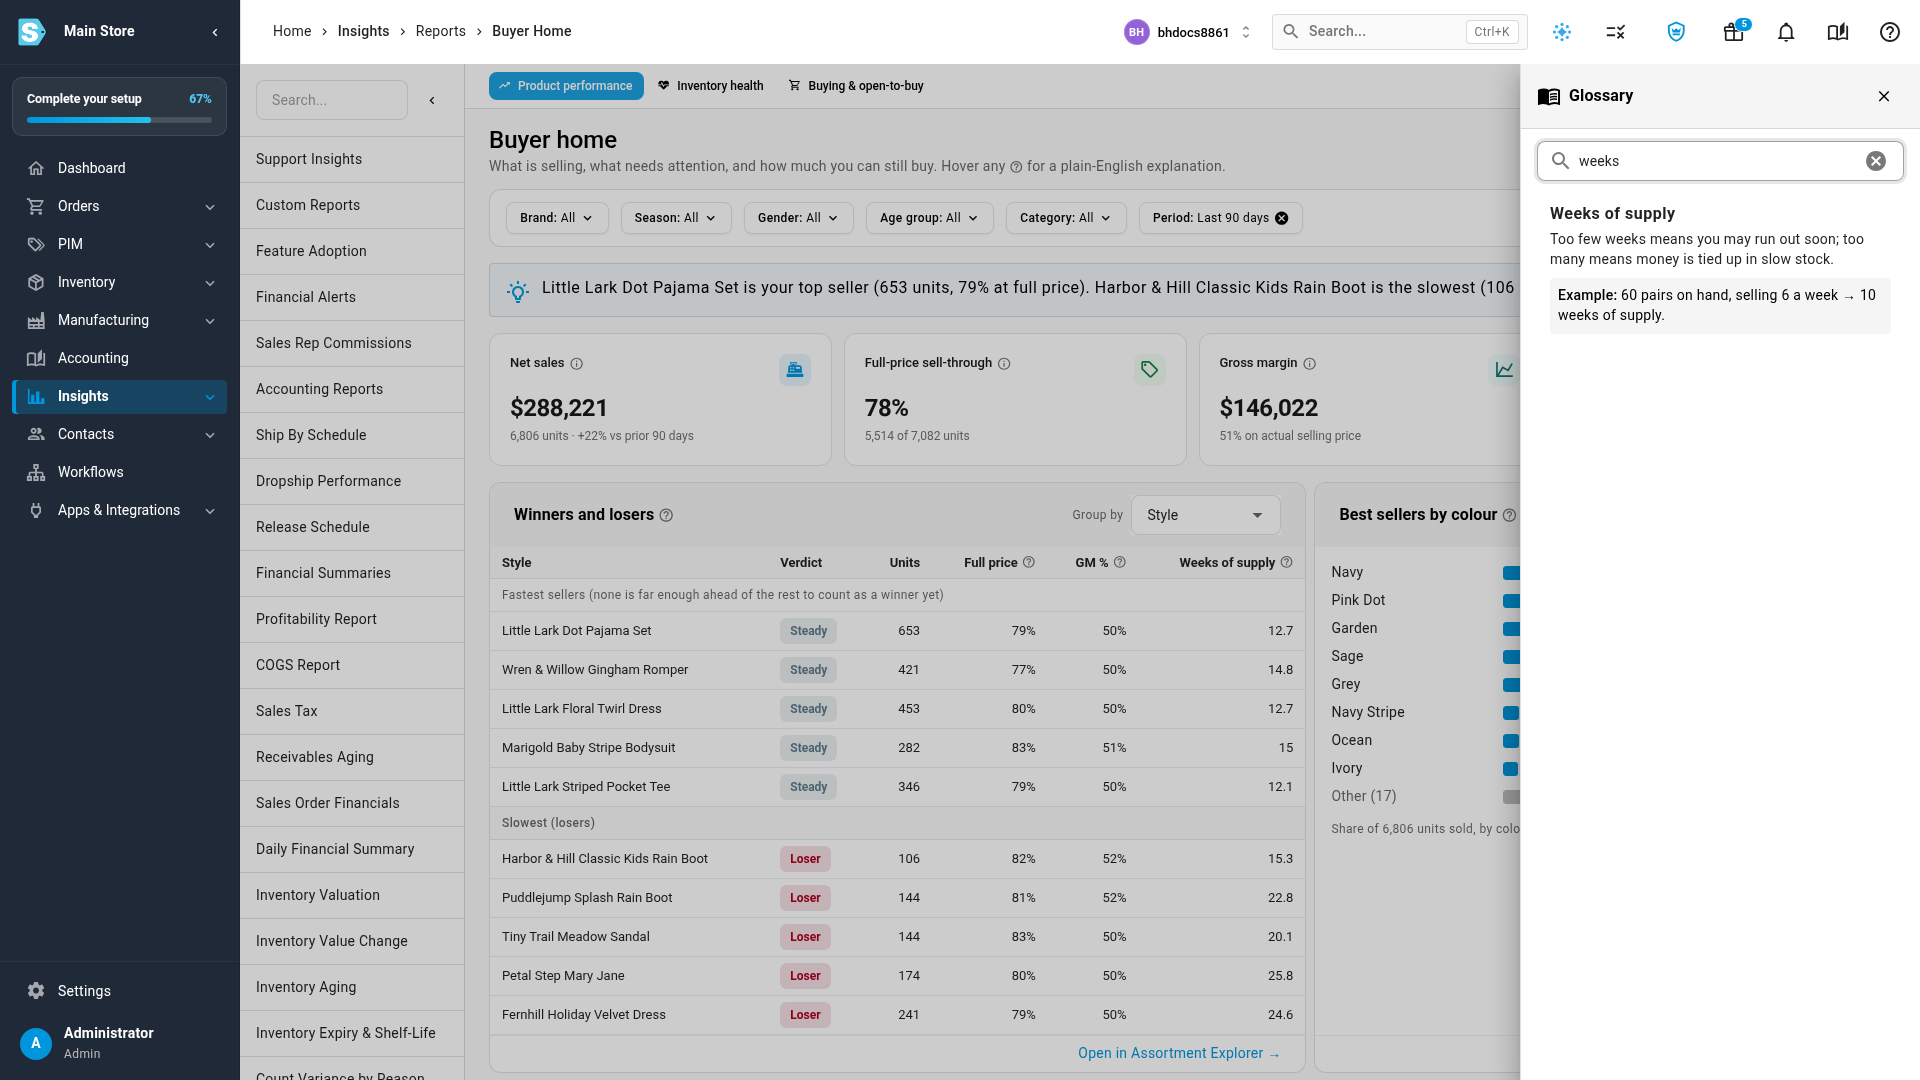
- Read the tiles: Net sales, Full-price sell-through, Gross margin and GMROI. Hover the help icon next to any name for a plain-English explanation.
- To narrow every card at once, use the filters: Brand, Season, Gender, Age group, Category and Period. Click Clear to remove them.
- In Winners and losers, see which styles sell much faster or much slower than the rest. Use Group by to compare brands, colours or any other attribute instead.
- In Best sellers by, pick an attribute. Size shows the size curve for one category; any other attribute shows each value's share of units.
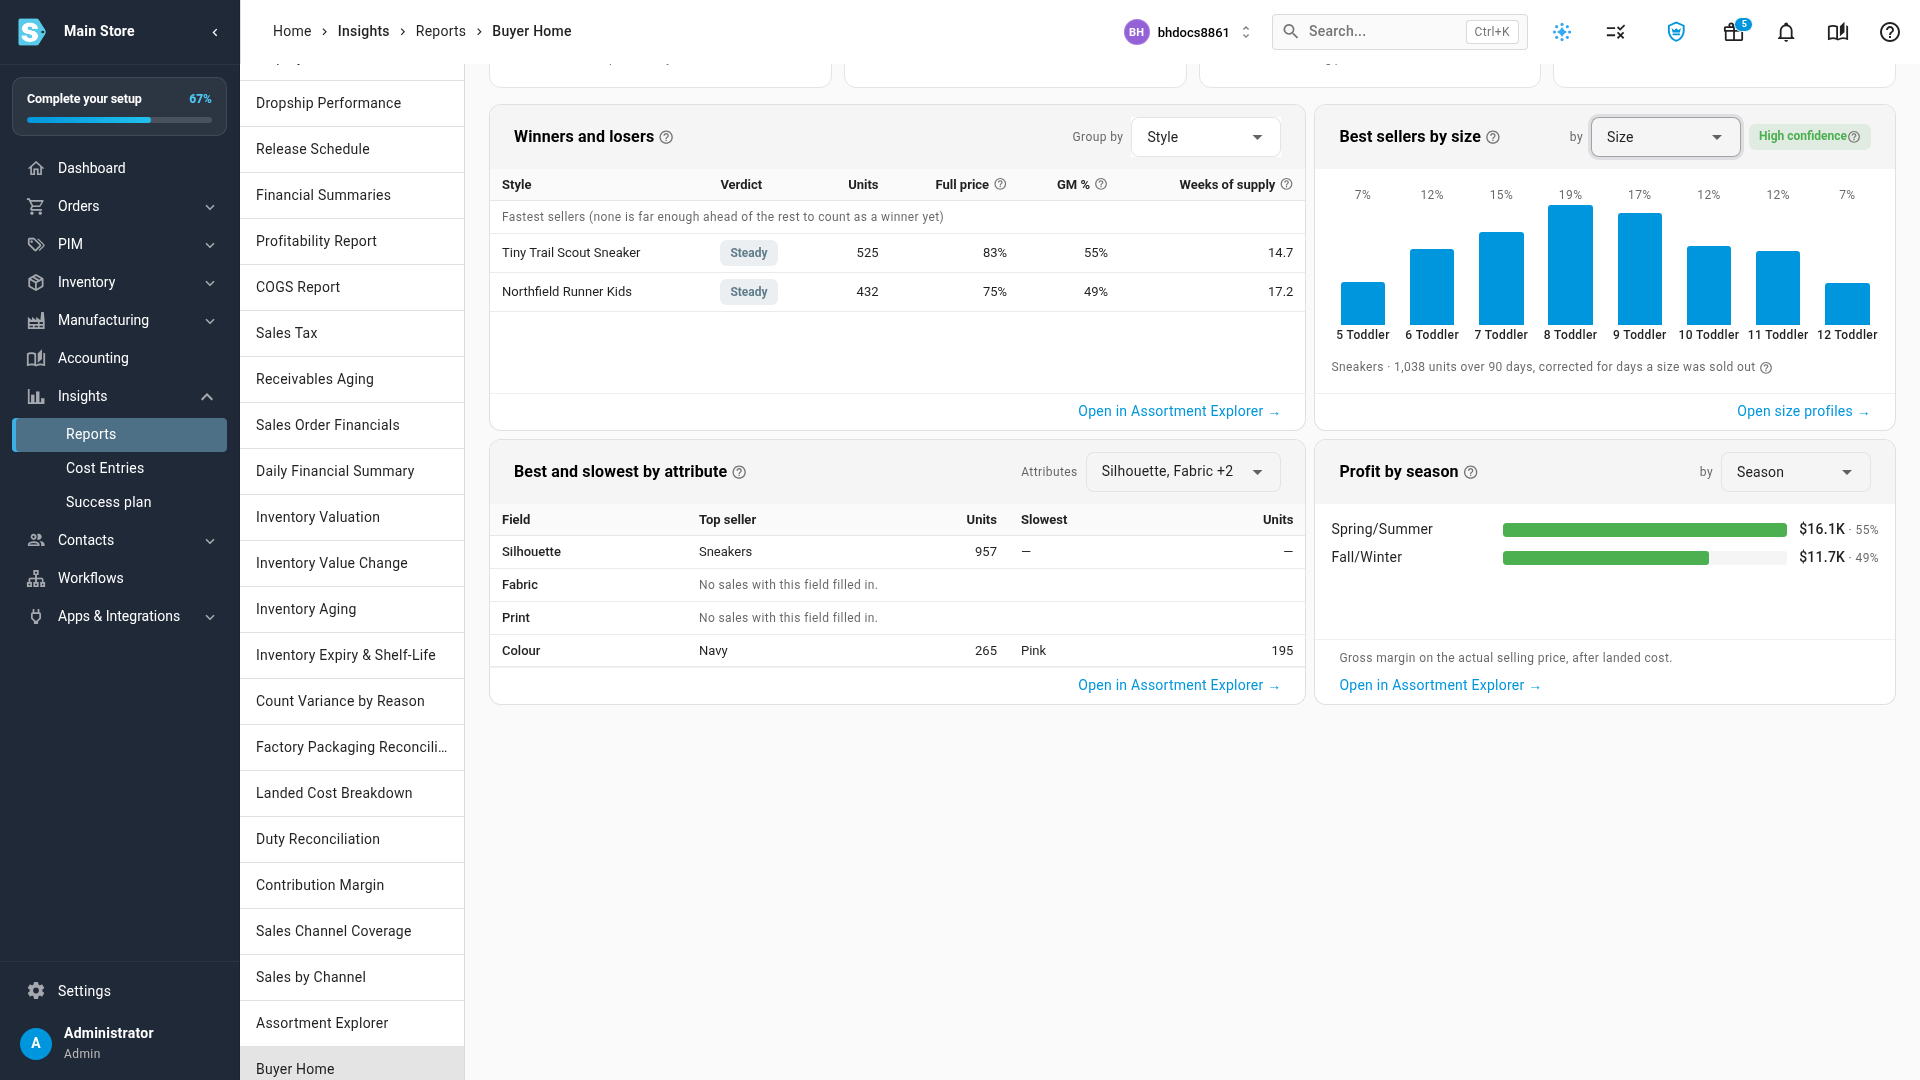
- Scroll to Best and slowest by attribute and Profit by to see the top and bottom values and the gross margin for the attributes you pick.
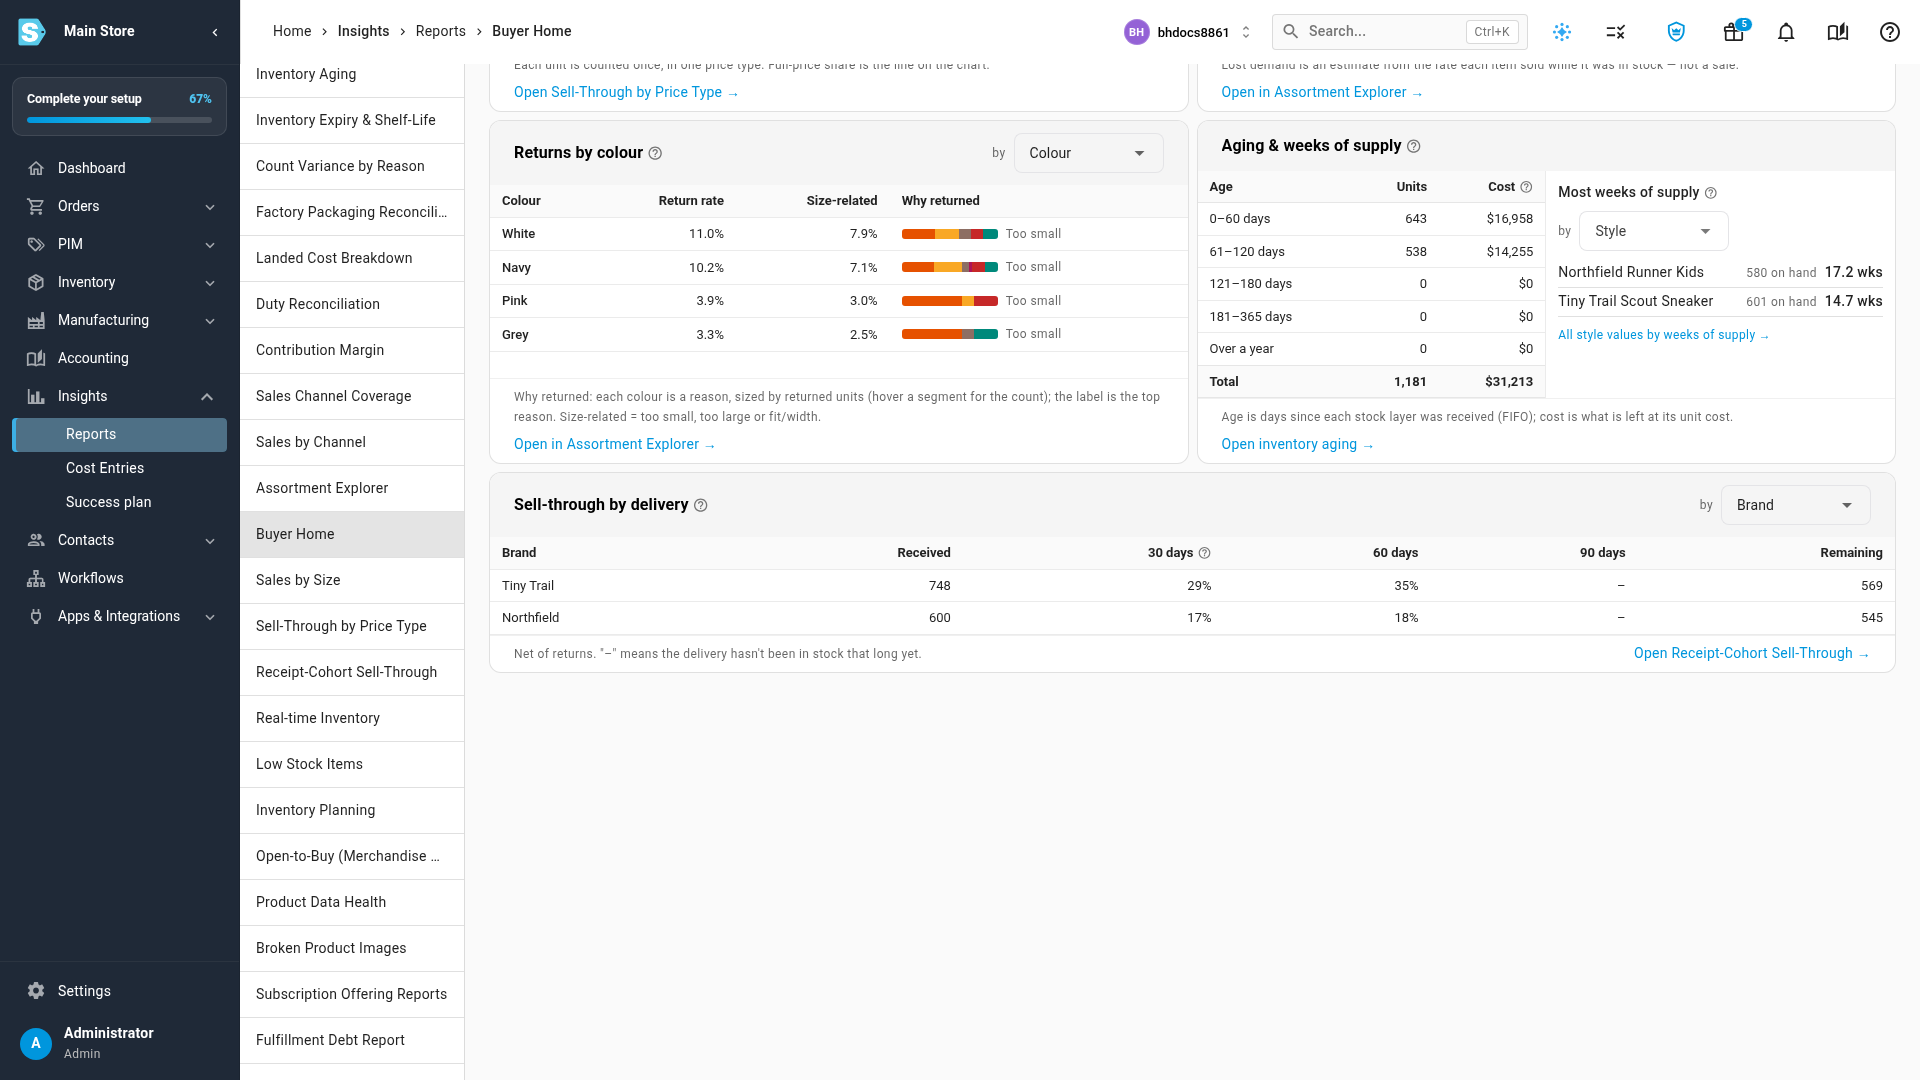
- Click the Inventory health tab to see lost sales, discounts, sold-out sizes, returns, aging and how fast each delivery sells.
- Click Glossary to search the terms used on the page. Press Esc to close it.
Each card loads on its own. When a card's table is wider than the card, a shaded edge and a thin scroll bar show that more columns sit to the side; scroll the table to see them. If one can't load, it shows This card couldn't load with a Retry button, and the rest of the page still works. Click Refresh at the top to reload every card.
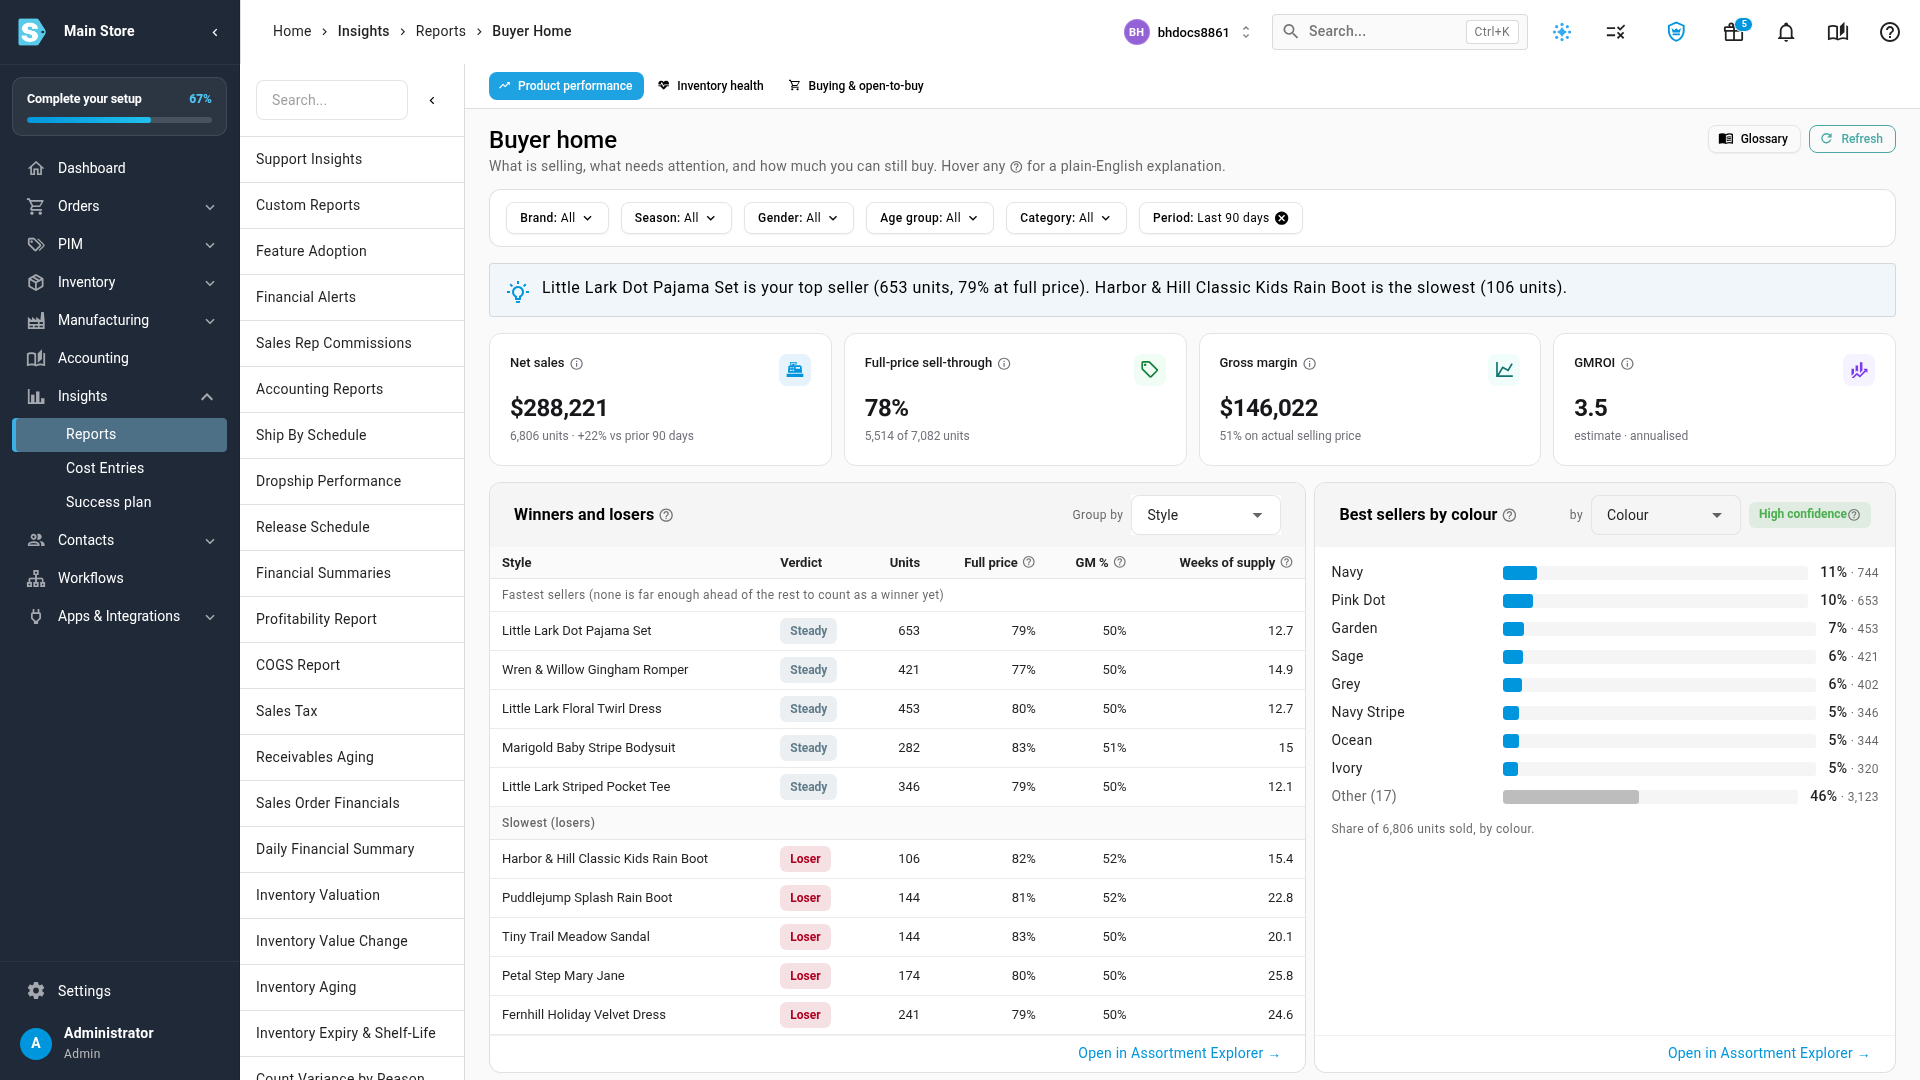
The filters
The filters sit above every tab and apply to every card on it. They are kept in the page's address, so you can bookmark or share a filtered view.
| Filter | What it narrows |
|---|---|
| Brand | Products of the brands you pick |
| Season, Gender, Age group | Products whose attribute has the values you pick. Greyed out if your store has no such attribute |
| Category | Products in the categories you pick |
| Period | The sales window, such as Last 90 days. The Buying & open-to-buy tab always covers this month and the next 11, so it hides this filter |
Product performance
| Card | What it shows |
|---|---|
| Net sales | What customers paid after discounts, before tax and shipping, minus returns, and the change against the previous period of the same length |
| Full-price sell-through | The share of units sold with no discount of any kind |
| Gross margin | Selling price minus what you paid the vendor |
| GMROI | How many dollars of gross margin a year each dollar of stock (at cost) earns. It's an estimate |
| Winners and losers | Styles (or the attribute you group by) labelled Winner, Steady or Loser by how fast they sell compared with the rest, with units, full-price share, margin and weeks of supply. When nothing is far enough ahead to count as a winner, the card lists the fastest sellers instead |
| Best sellers by | Pick Size to see the size curve: the share each size sells, corrected for the days a size was sold out. Pick one category first, so sizes from different kinds of product aren't mixed. A chip shows High, Medium or Low confidence, and Open size profiles takes you to size profiles. Pick any other attribute to see the top eight values, then Other and Not set, as a share of units |
| Best and slowest by attribute | For each attribute you pick (up to six), the value that sold the most units and the one that sold the fewest |
| Profit by | Gross margin for each value of the attribute you pick, such as brand or season |
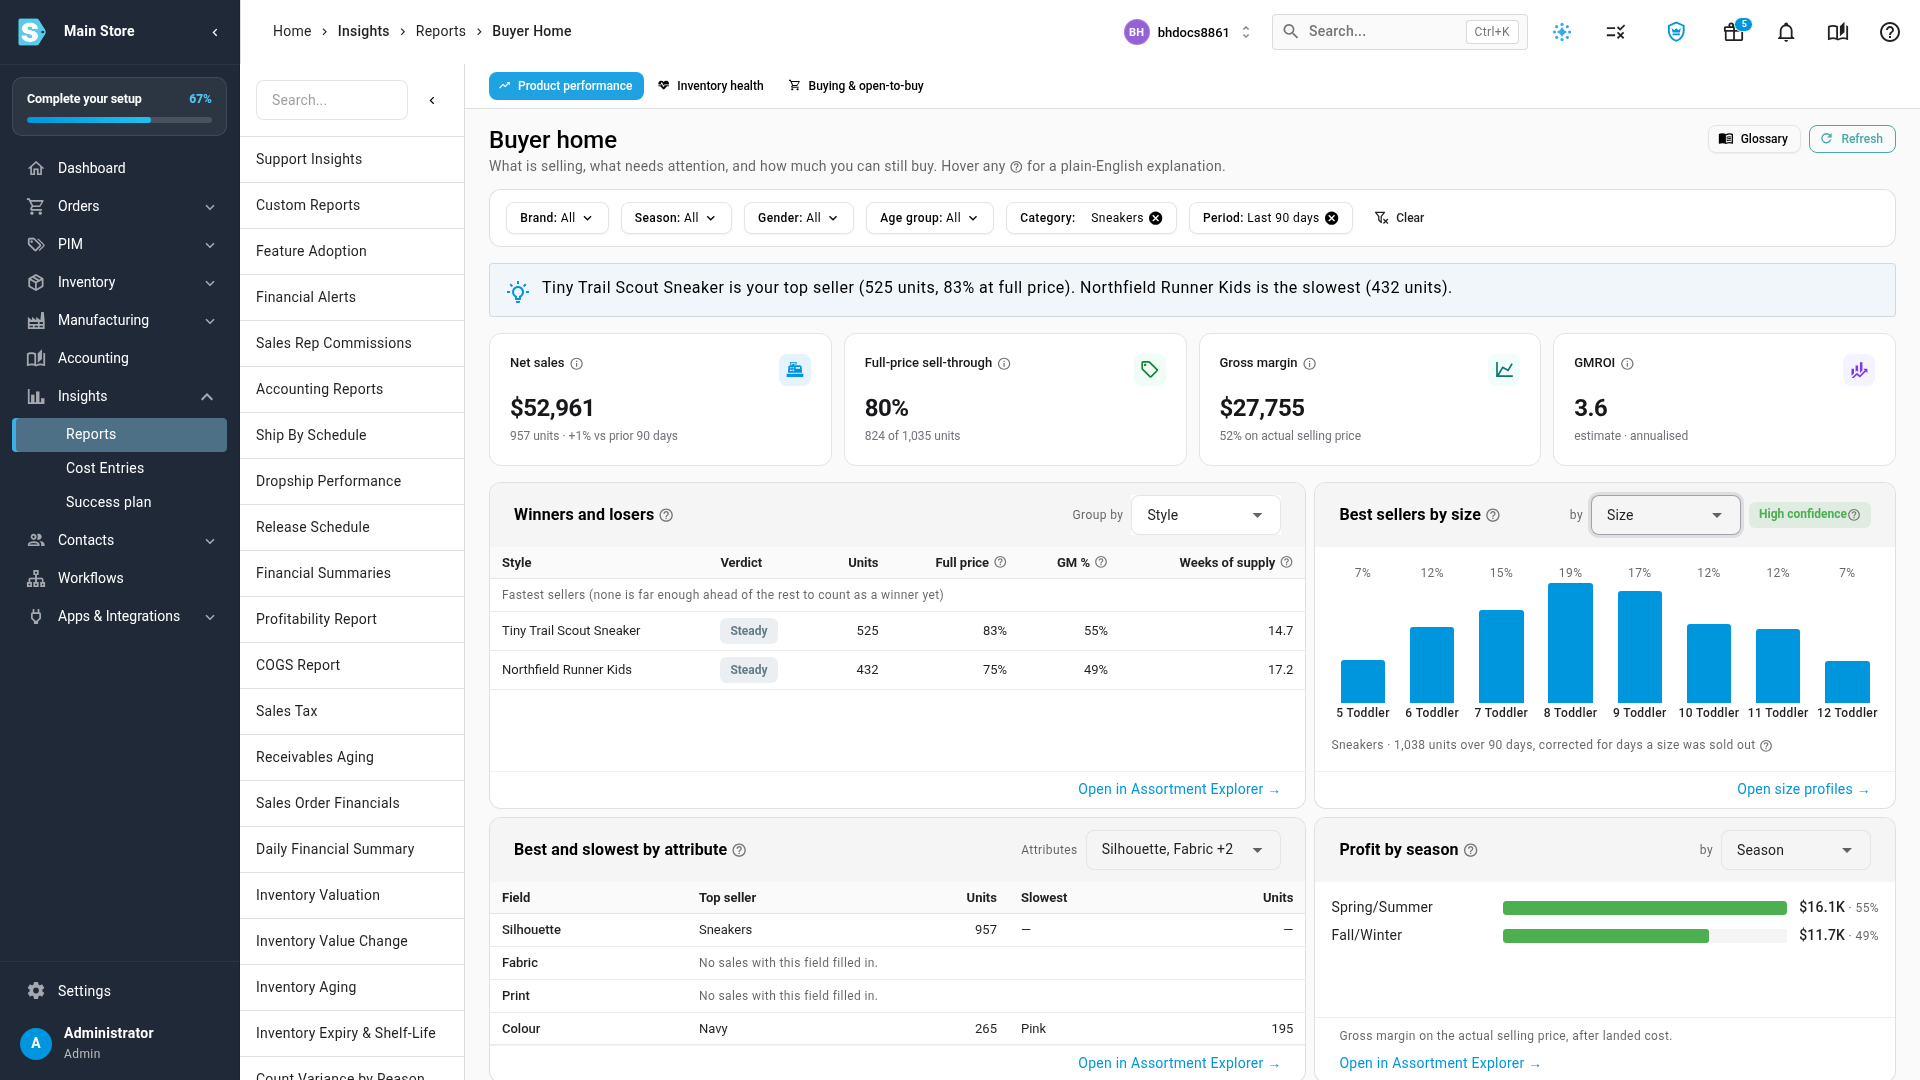
Each card's picker remembers your choice, so the card opens the same way next time, on any device you sign in from. Most cards end with Open in Assortment Explorer, which opens the same view with every row and filter there. To learn that report, see Find winners and losers with the Assortment Explorer.
Inventory health
| Card | What it shows |
|---|---|
| Units lost to stockouts (est.) | An estimate of sales missed while sizes were sold out, worked out from the rate each item sold while it was in stock, with its confidence |
| Stockout days | Days sizes spent sold out in the period |
| Weeks of supply | How many weeks your stock on hand lasts at the recent selling rate |
| Aged over 180 days | Stock, at cost, that arrived more than 180 days ago |
| Return rate | The share of units sold that came back, and how much of that was size-related |
| Sales by discount type | Units (or net sales, with the Net $ switch) each week, split into full price and each kind of discount, with the full-price share as a line. Open Sell-Through by Price Type opens the full report |
| Sizes that sold out | Days in stock, stockout days and the estimated lost units and sales, by size or the attribute you pick |
| Returns by | For each size (or the attribute you pick): the return rate, the size-related share (too small, too large, or fit or width), and Why returned, a bar with one colour per return reason sized by returned units, labelled with the top reason. Hover a segment to see the reason and its units |
| Aging & weeks of supply | Stock grouped by how many days ago it arrived, and the styles (or the attribute you pick) with the most weeks of supply. Open inventory aging opens the full report |
| Sell-through by delivery | For stock received on purchase orders in the period, how much sold within 30, 60 and 90 days of arriving, by brand or the attribute you pick. A dash means the delivery hasn't been in stock that long yet |
Look up a term
Hover the help icon next to a tile, a column or a card title for a short definition. For the full list, click Glossary: it opens a panel of plain-English terms, each with an example, and you can search it. Press Esc or click the close button to close it.
Next steps
- Plan buys with open-to-buy on Buyer home
- Find winners and losers with the Assortment Explorer
- Build size curves from sales
Video transcript
To see what is selling and what needs attention, open Insights in the sidebar, and then choose Reports. They are all on the left; scroll down to find Buyer Home. Click it to open the Product performance tab. It has three tabs: product performance, inventory health, and buying and open-to-buy. Each tab opens with a one-line answer, built from the cards below. The tiles show net sales, full-price sell-through, gross margin, and the margin each dollar of stock earns. Hover the help icon next to any name for a plain-English explanation. The filters at the top narrow every card at once: brand, season, gender, age group, category, and period. Here we open Category, search, and pick one. The answer and every card update, so you compare like with like. Winners and losers ranks your styles by how fast they sell compared with the rest. Use Group by to compare brands, colours, or any other attribute instead. Best sellers shows each value's share of units, for whichever attribute you pick. Choose Size from the picker to see the size curve, corrected for the days a size was sold out. The confidence chip says how far you can trust these numbers. Each card remembers your choice for the next time you open the page. Below, Best and slowest by attribute lists the top and bottom value for up to six attributes. Profit by shows gross margin for each brand, season, or other field you pick. Each card links to the Assortment Explorer for the full detail. Now open the Inventory health tab, which shows what is holding your stock back. Units lost to stockouts estimates the units you missed while sizes were sold out. Sales by discount type splits each week into full price and each kind of discount. Sizes that sold out, and Returns by, use the same attribute picker. Returns by shows each value's return rate, with a coloured bar of why items came back, labelled with the top reason. Aging shows how long stock has sat, and which styles have the most weeks of supply. Sell-through by delivery tracks how much of each delivery sold within thirty, sixty, and ninety days. Not sure what a term means? Click Glossary, and search the plain-English definitions; each one comes with a short example. Close the panel when you are done.