Find slipping suppliers with Supplier Analytics
Supplier Analytics puts every supplier side by side: how much you buy from them, how much their products sell for, the profit and margin those products earn, and how all of it is changing. Use it to find the suppliers that carry your business, the ones that are slipping, and the ones worth a harder conversation.
Before you begin
- You need access to Supplier Analytics.
- The figures come from your purchase orders and from sales of each supplier's products. SKU.io refreshes them every night, and the date under the period shows when they were last refreshed.
Choose the period and what counts as growth
- Go to Insights → Reports and open Supplier Analytics.
- Choose a comparison: YoY (this year against last year), QoQ, MoM, or Custom for your own two periods. The dates being compared show at the top right.
- Under Growth basis, choose what growth is measured on: Spend, Sales, Profit, or Margin.
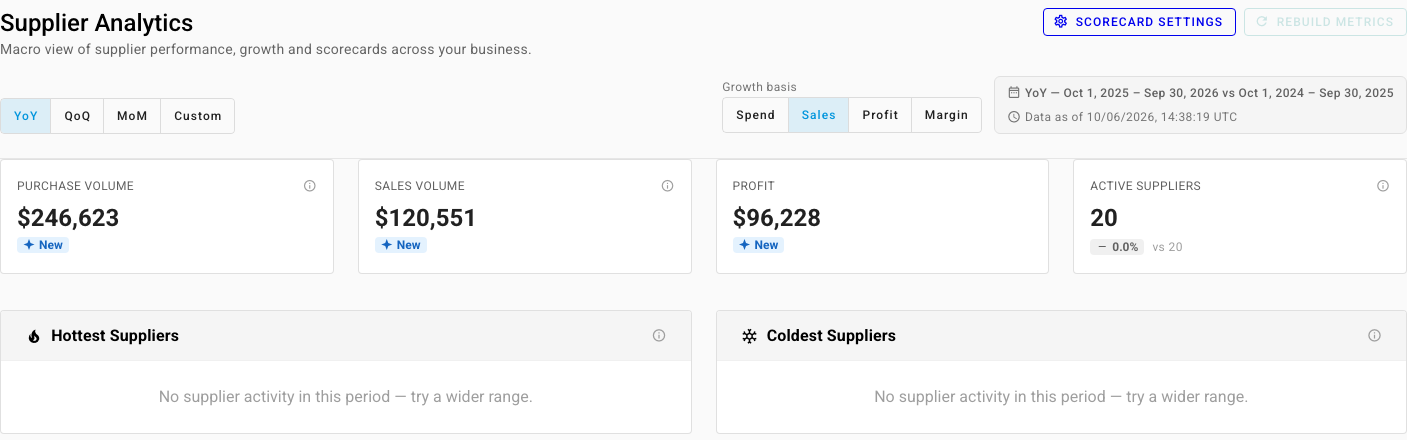
The four tiles show Purchase Volume, Sales Volume, Profit, and Active Suppliers (suppliers with at least one purchase order in the period), each with its change against the comparison period. New means there was no activity in the earlier period to compare against.
See who's growing and who's slipping
- Hottest Suppliers and Coldest Suppliers list the suppliers with the strongest growth and the largest decline on your growth basis. When neither period has activity for a supplier, it doesn't appear here.
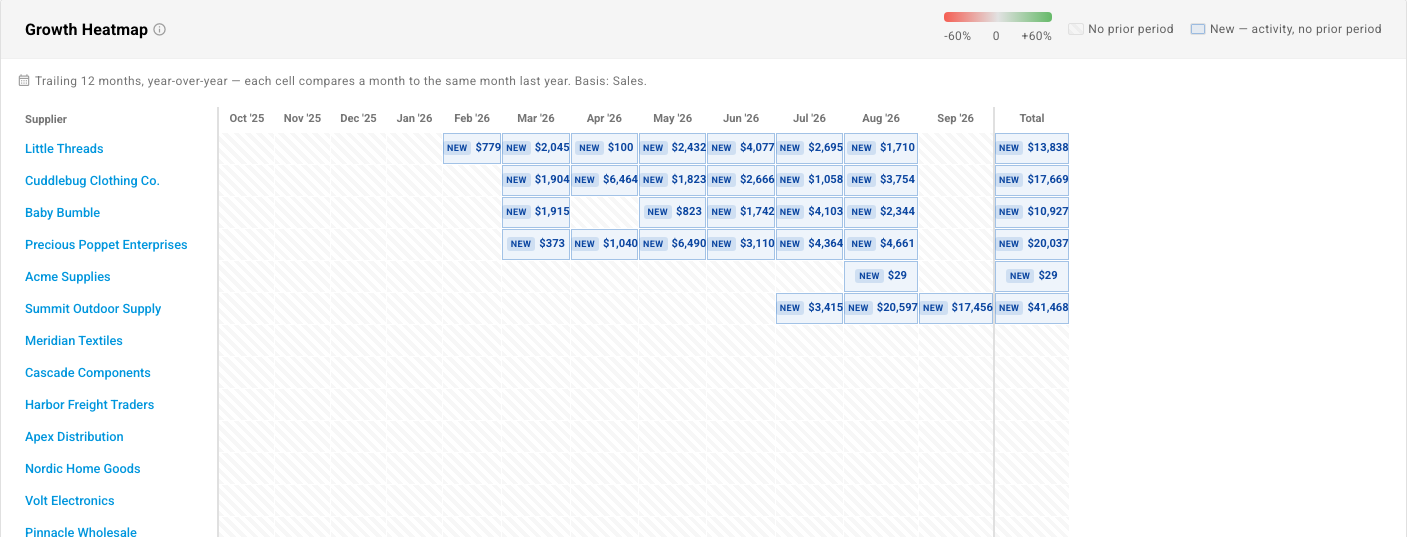
- The Growth Heatmap shows each supplier's last 12 months. Each cell compares a month with the same month a year earlier, green for growth and red for decline. A blue New cell has activity but nothing a year before.
Rank suppliers in the leaderboard
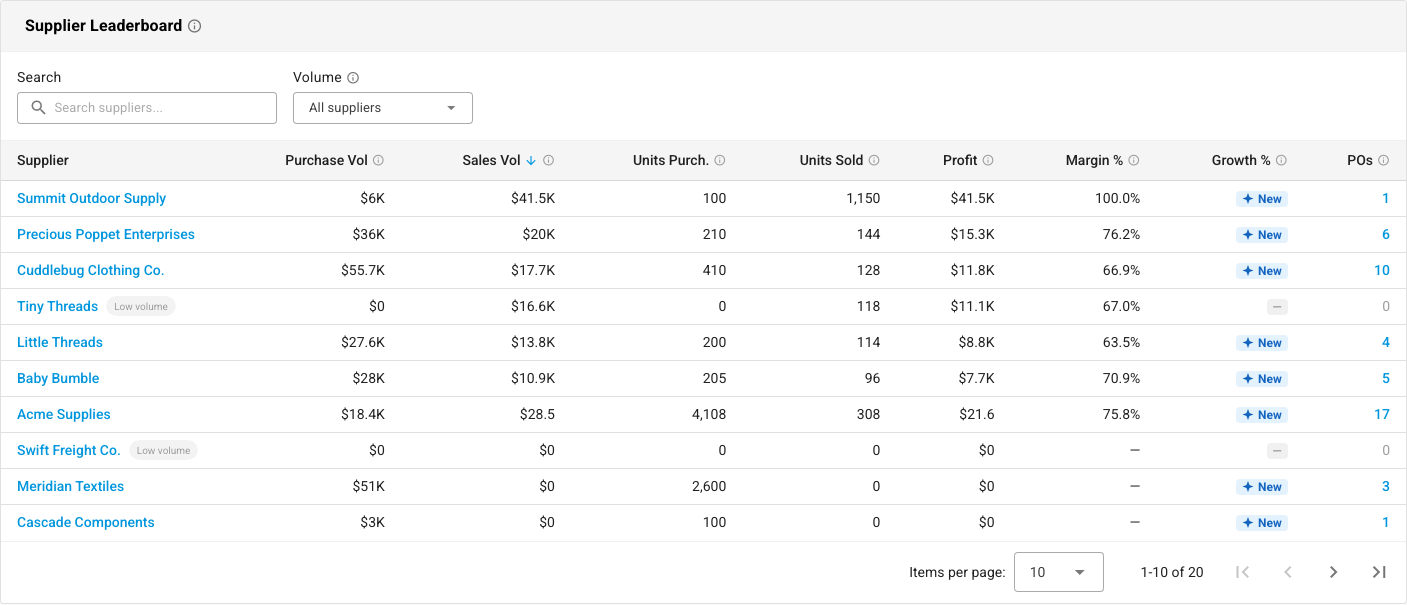
The Supplier Leaderboard lists every supplier with Purchase Vol, Sales Vol, Units Purch., Units Sold, Profit, Margin %, Growth %, and POs. Hover over a column's ⓘ to see what it counts.
- Click a column header to sort by it.
- Type in Search to find a supplier.
- Suppliers with little activity carry a Low volume tag, because their percentages can swing widely. Use Volume to show All suppliers, Above threshold only, or Low volume only.
- Click a supplier's name to open its Analytics on the supplier's Performance tab, with its trend, its products, and its scorecard.
Score suppliers
Each supplier's scorecard rates it from 1 to 5 on how reliably it delivers and how competitively it prices: on-time delivery, lead-time reliability, fill rate (units received against units ordered), defect and return-to-vendor rate, cost competitiveness, and price stability. The overall score weights those dimensions.
To change how much each dimension counts, click Scorecard Settings at the top of Supplier Analytics. Changes apply to every supplier scorecard.
Set purchasing targets
To compare what you buy from each supplier with a monthly budget, open Purchasing Targets from Insights → Reports. It sets a target per supplier and month and shows Target vs actual purchase order volume. See Set monthly purchasing targets.
Next steps
- Rank suppliers and products by return with IRR Analytics: how hard the cash you spend with each supplier works.
- Track product performance with Product Analytics: the same view for individual products.