Track brand performance with Brand Analytics
Brand Analytics answers three questions about the brands you buy and sell: which carry the business, which are growing, and which are fading. It ranks every brand by what you buy from it and what you sell of it, compares the current period with an earlier one, and scores how well each brand's goods arrive. It's different from Brand Reports, which are the weekly and monthly reports you send to the brands you distribute.
Before you begin
- Your role needs access to Brand Analytics under Report Access.
- Products count toward a brand through the Brand set on each product. Purchase figures come from your purchase orders, and sales figures from your sales orders.
- SKU.io refreshes the figures every night. Data as of under the period shows when they were last refreshed. If you've just added a lot of history, click Rebuild metrics to refresh them now.
Steps
- Go to Insights → Reports and choose Brand Analytics.
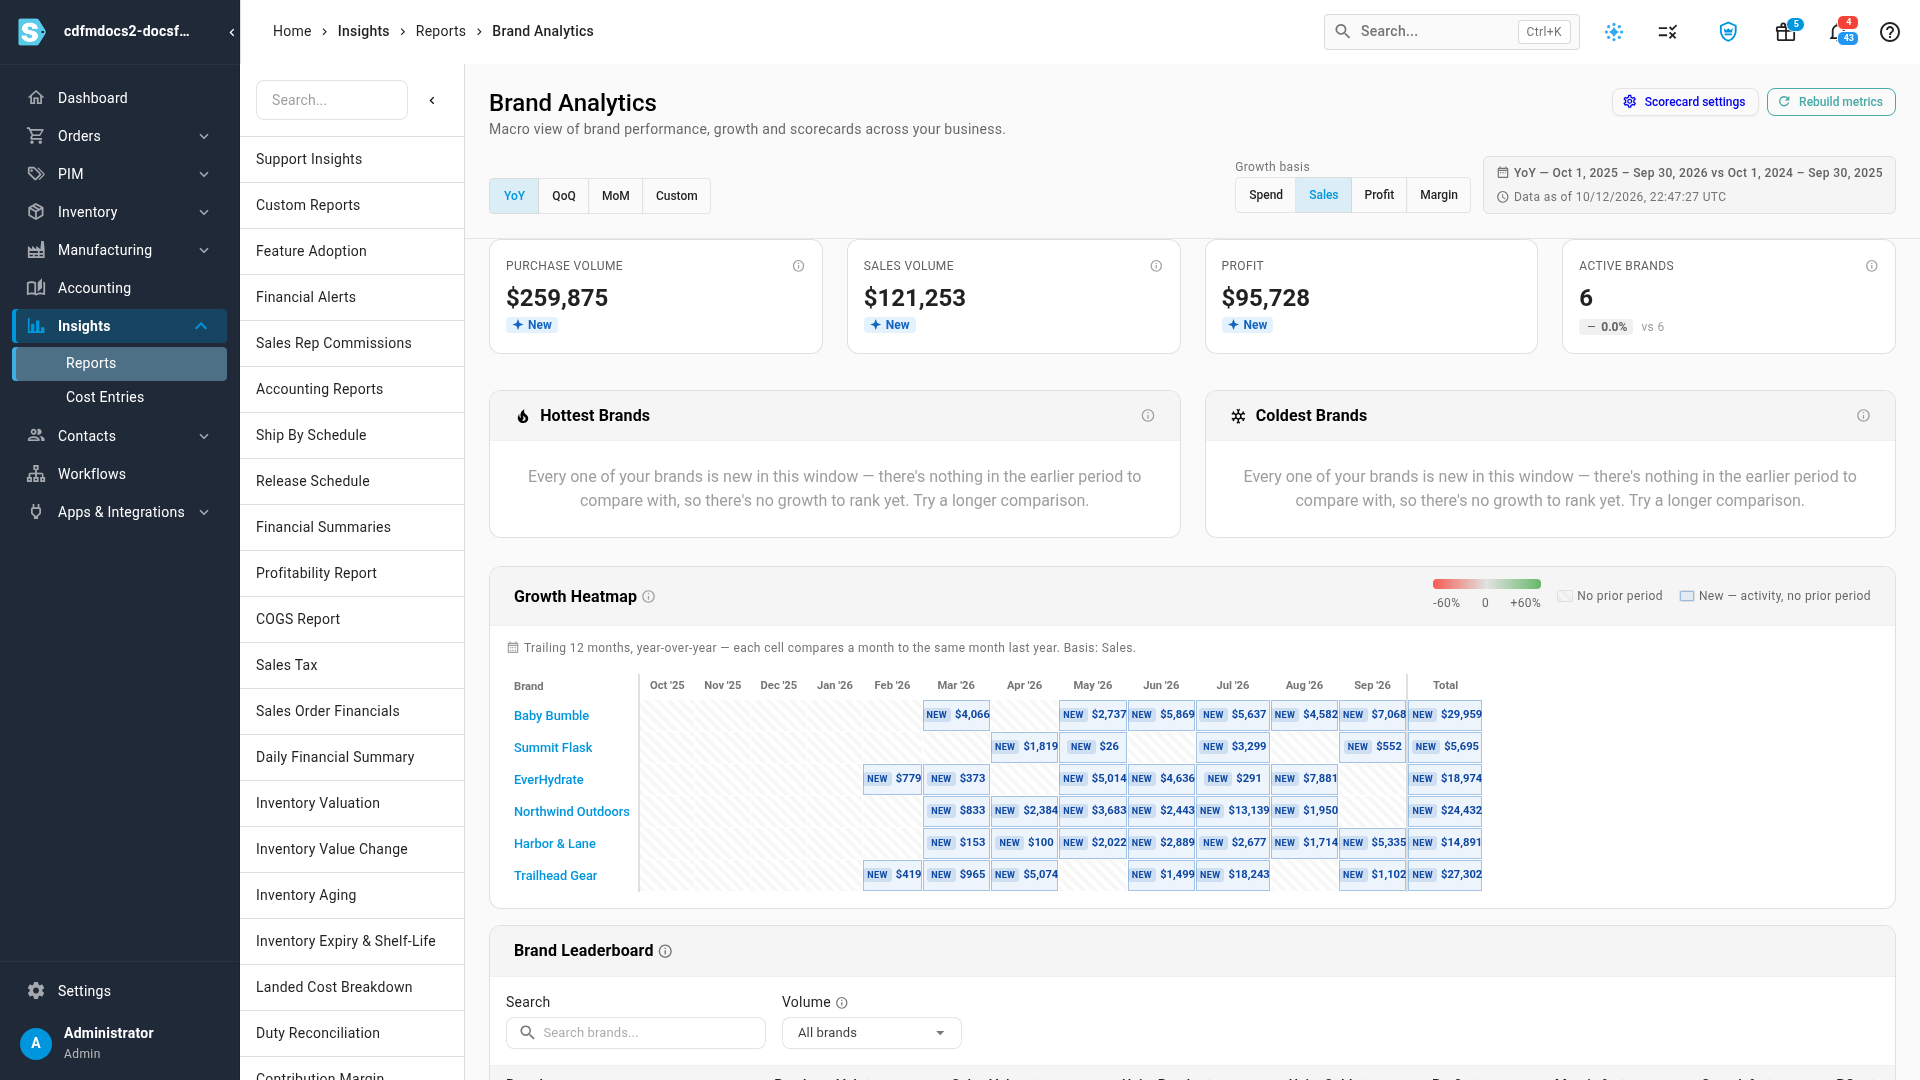
- Choose a comparison: YoY (the last 12 full months against the 12 before), QoQ, MoM, or Custom to set your own From and To dates and click Apply. The dates being compared show at the top right. A period that's still in progress is compared with the same number of days in the earlier period.
- Under Growth basis, choose what growth is measured on: Spend, Sales, Profit or Margin.
- Read the tiles across the top: Purchase Volume (what you spent on purchase orders), Sales Volume, Profit and Active Brands (brands with at least one purchase order in the period), each with its change against the earlier period. New means there's nothing in the earlier period to compare with.
- Check Hottest Brands and Coldest Brands for the brands with the strongest growth and the steepest decline on your growth basis. When every brand is new in the window, there's no growth to rank yet; pick a longer comparison.
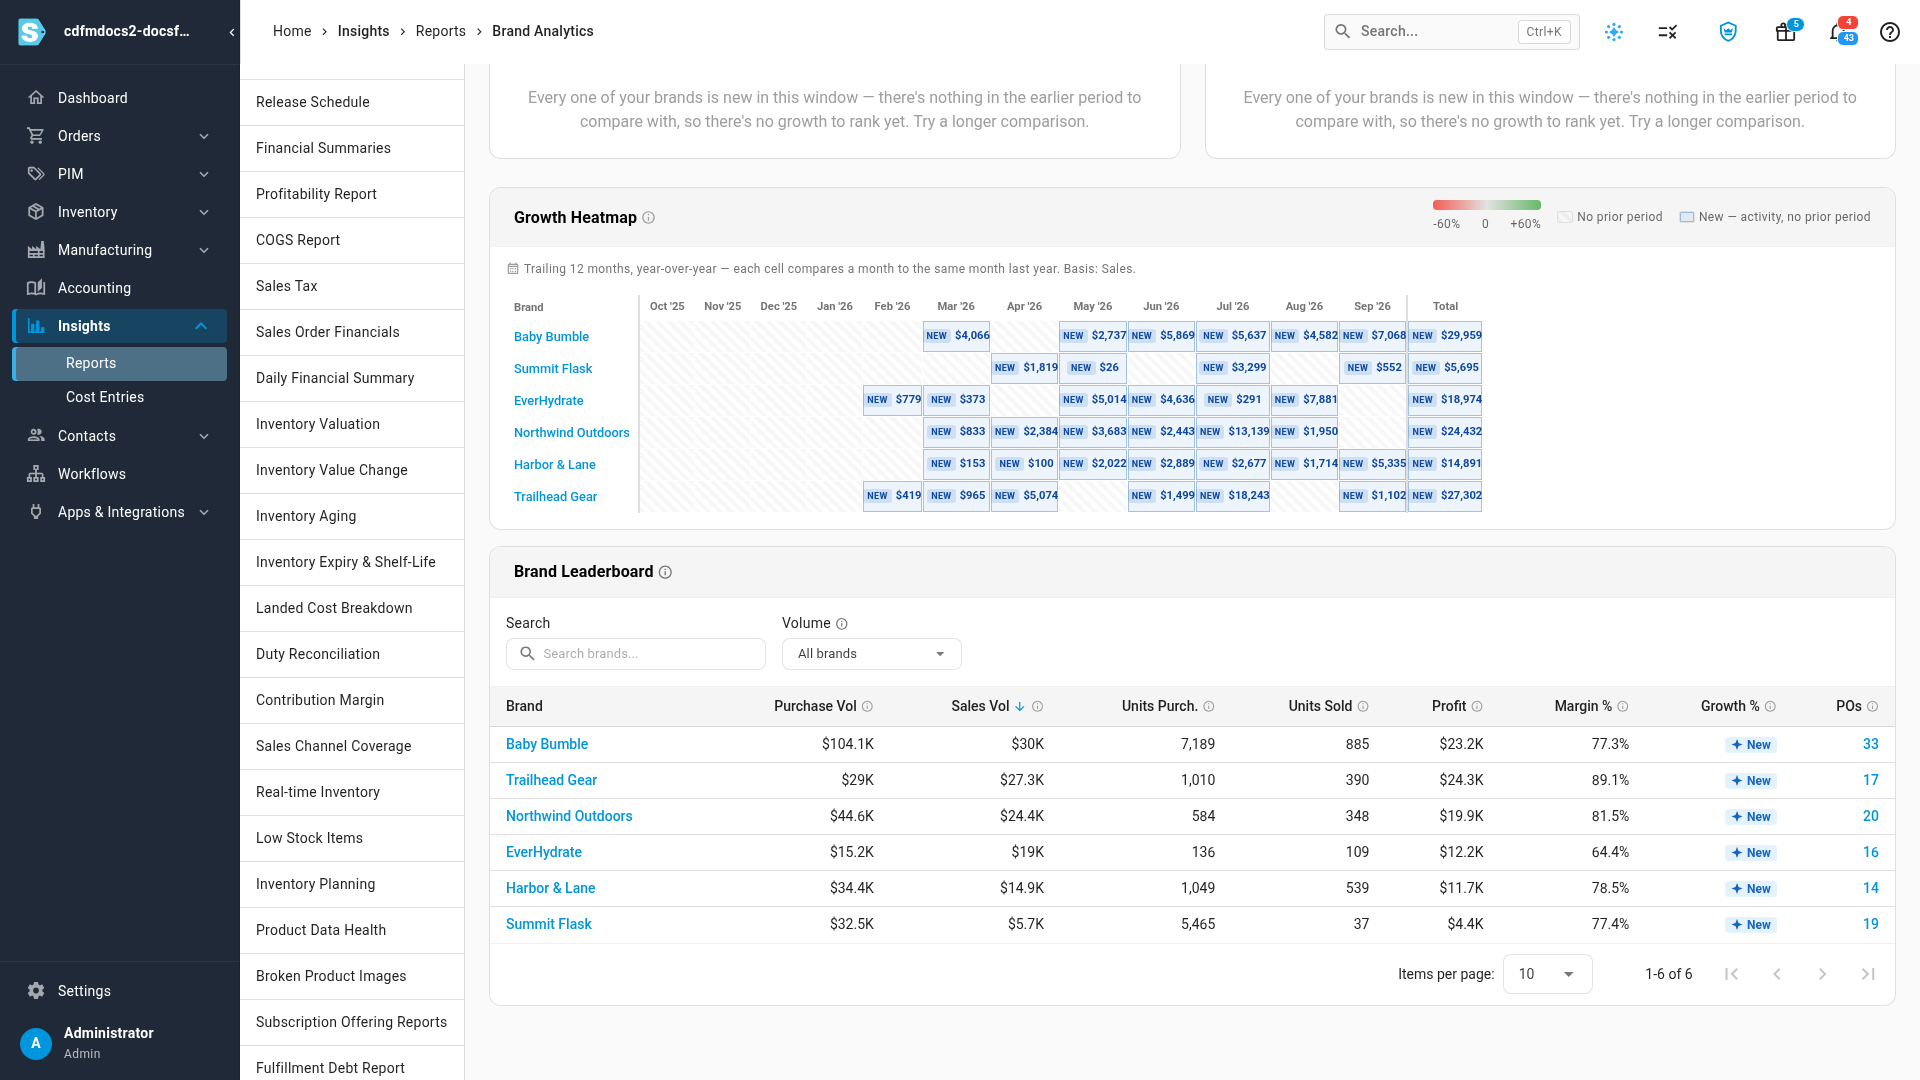
- Scan the Growth Heatmap: one row per brand and one cell per month, green for growth and red for decline against the same month a year earlier. A New cell has activity but nothing to compare with. Hover a cell to see both values.
- Use the Brand Leaderboard to rank every brand by Purchase Vol, Sales Vol, Units Purch., Units Sold, Profit, Margin %, Growth % or POs. Search for a brand, or use Volume to show only brands above the volume threshold, or only low-volume brands, whose percentages swing widely. POs opens the brand's purchase orders.
- Click a brand to open its own analytics.
Read a brand's analytics
A brand's Analytics tab has the same comparison and growth basis controls, and shows:
- tiles for Sales Vol, Units Sold, Purchase Vol, Units Purch., Profit and Margin %;
- the Brand Scorecard (see below);
- a Trend chart of the current period against the prior one, by spend, sales, units purchased, units sold, profit or margin;
- a Product Growth Heatmap for the brand's products;
- Calendar-Year Volume, purchases and sales by year.
Read a brand's scorecard
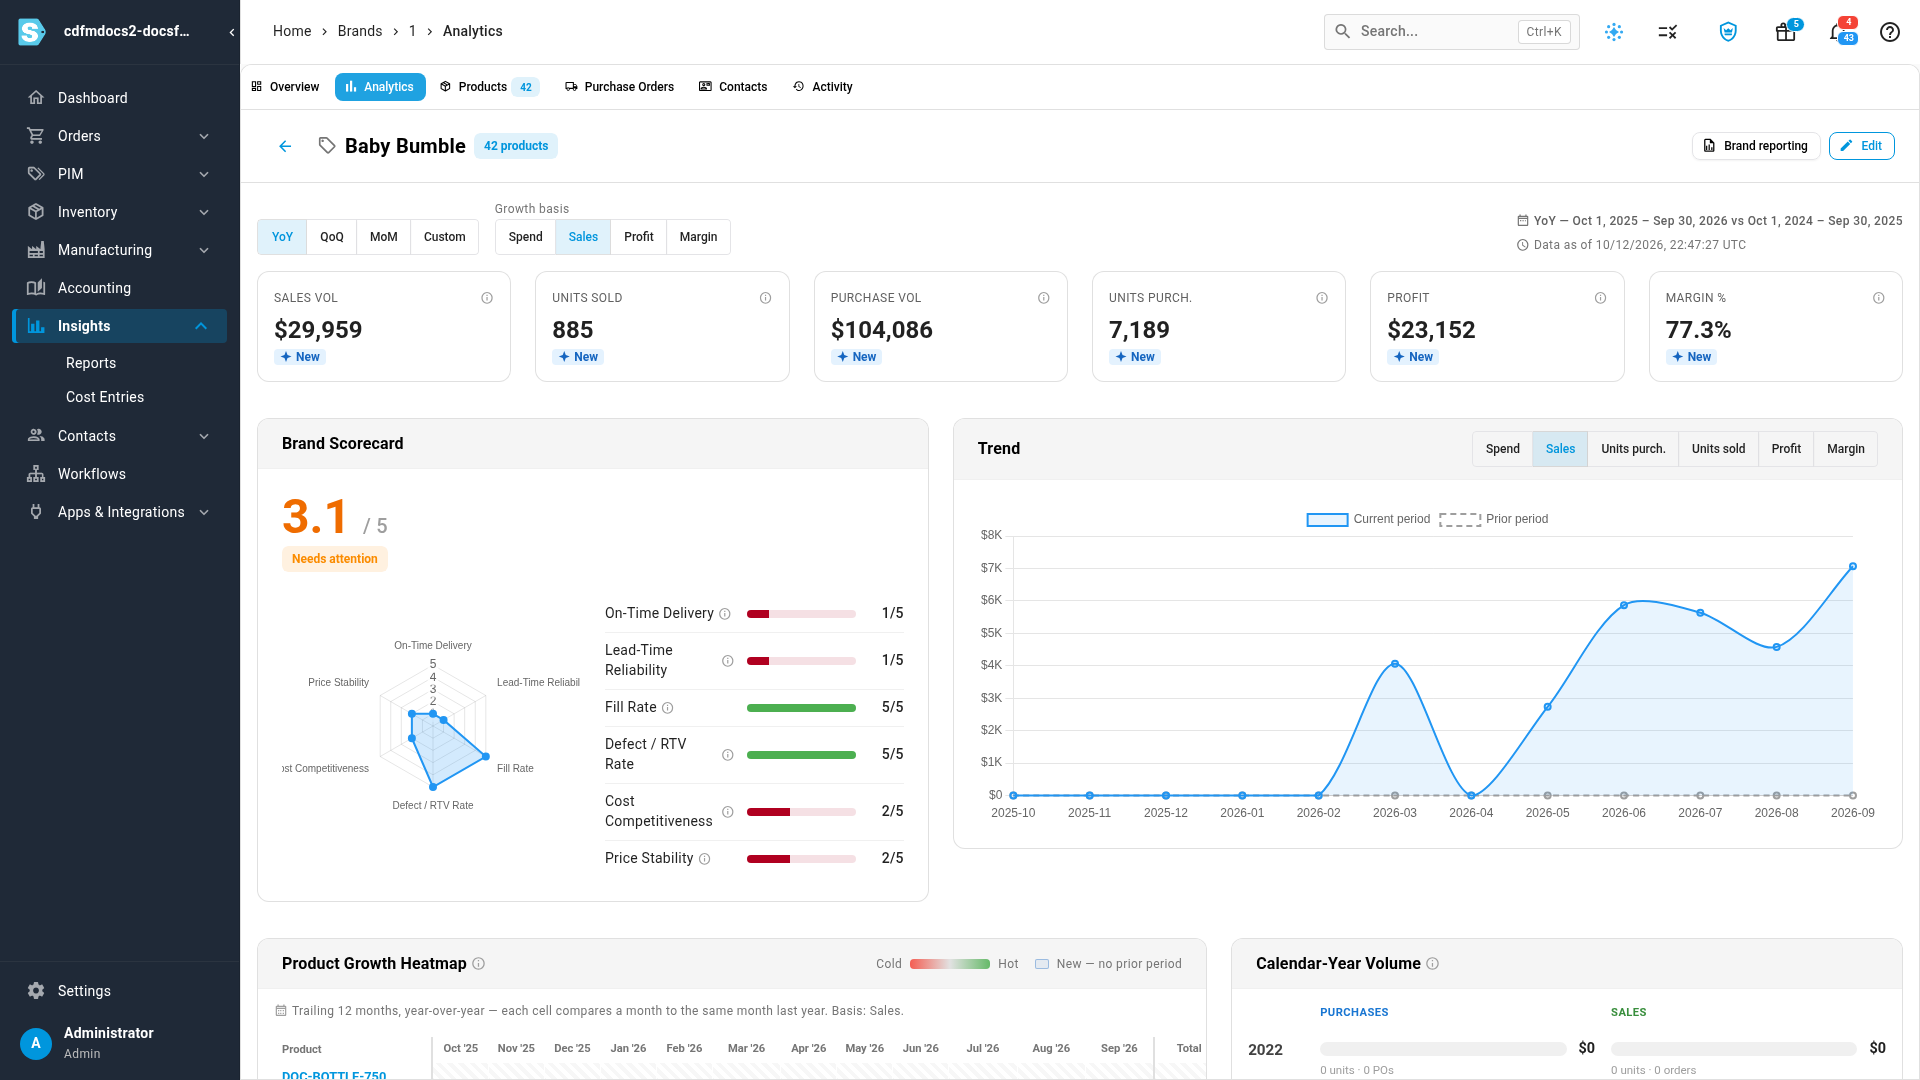
The Brand Scorecard rates the brand's supply from 1 to 5 on On-Time Delivery, Lead-Time Reliability, Fill Rate, Defect / RTV Rate, Cost Competitiveness and Price Stability, and combines them into an overall score out of 5 with a status such as Needs attention. A brand with fewer purchase orders in the period than the minimum shows Insufficient data instead of a score.
Change how scorecards are scored
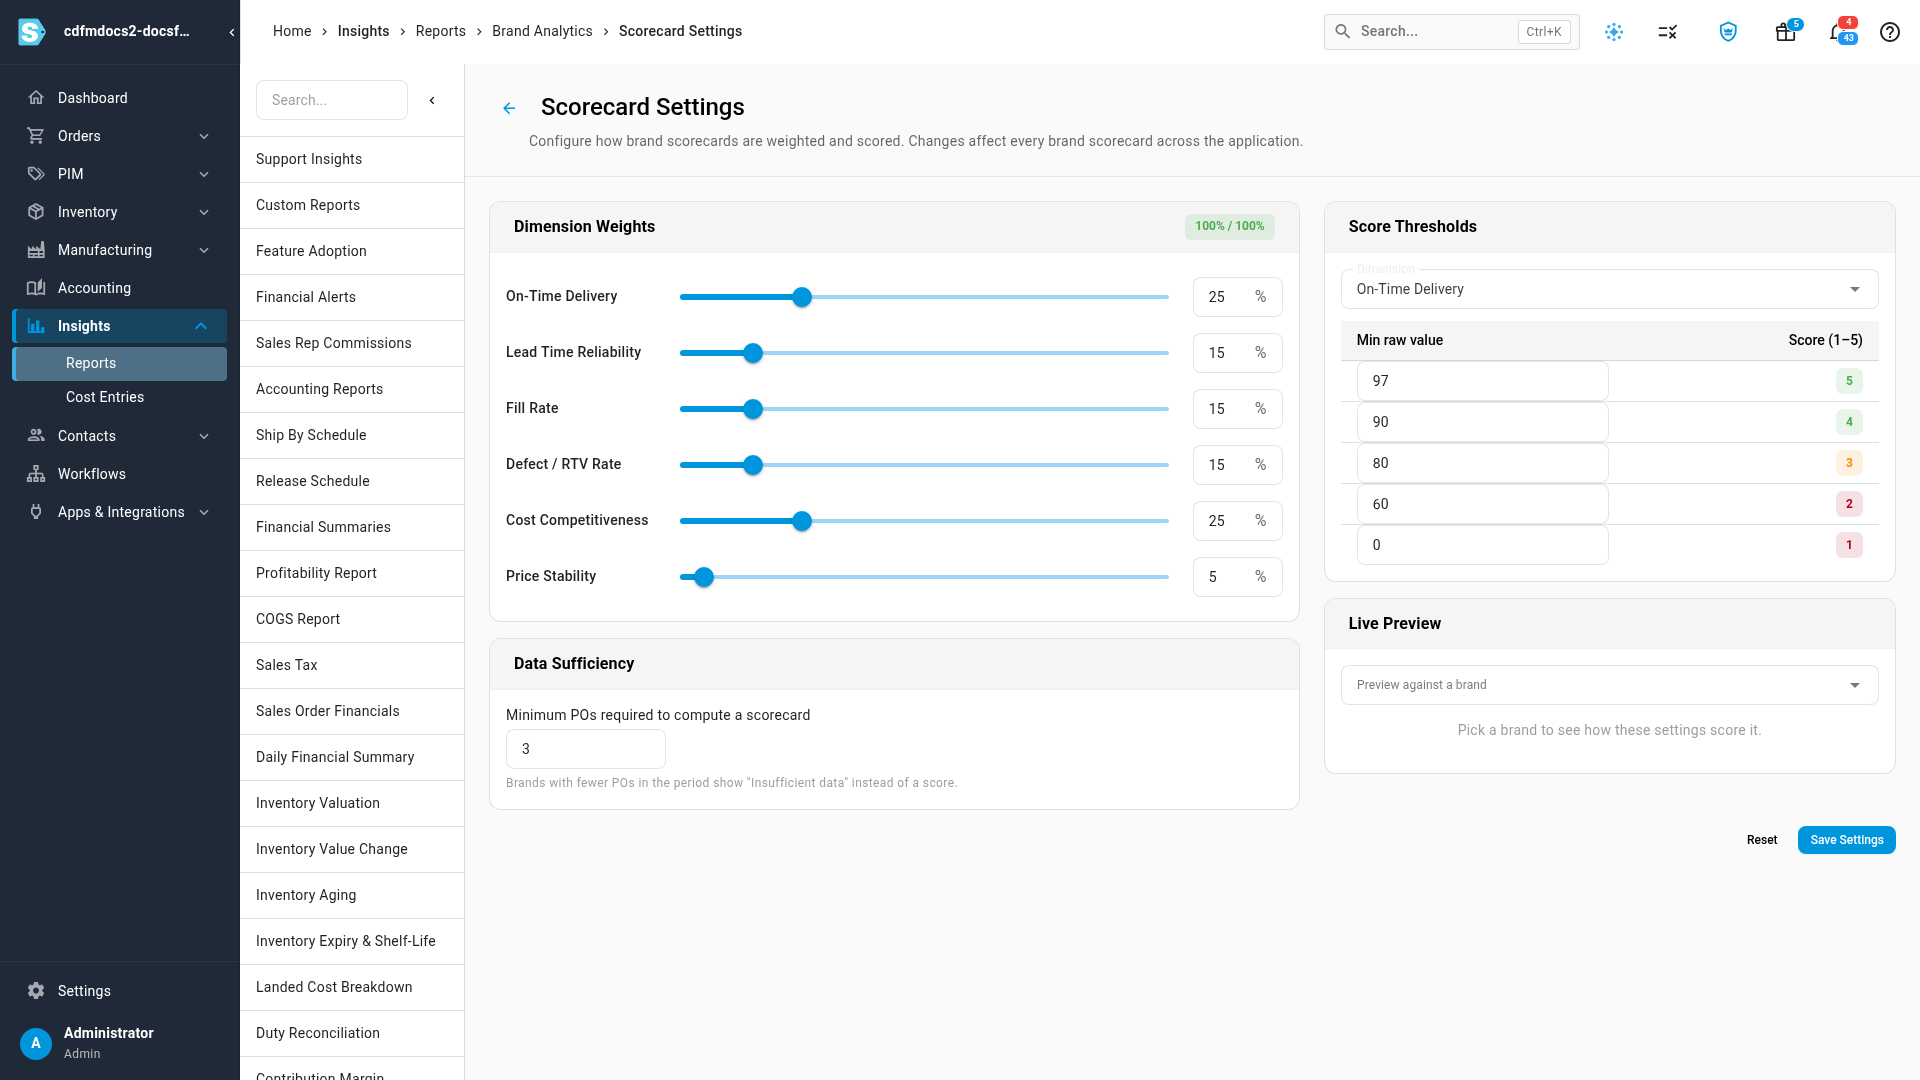
- On Brand Analytics, click Scorecard settings.
- Under Dimension Weights, set how much each measure counts. The weights must add up to 100%.
- Under Score Thresholds, pick a Dimension and set the Min raw value a brand needs for each score from 1 to 5.
- Under Data Sufficiency, set the Minimum POs required to compute a scorecard.
- Optionally, under Live Preview, pick a brand to see how it scores with your settings.
- Click Save Settings. Reset puts the defaults back.
The settings apply to every brand scorecard in SKU.io.
Next steps
- Track product performance with Product Analytics: the same view for products.
- Find slipping suppliers with Supplier Analytics: the same view for suppliers.
- Brand Reports: the reports you send to the brands you distribute.
Video transcript
To see how your brands are doing, open Insights in the sidebar, and then choose Reports. Scroll down the long list of reports, past the inventory and finance reports. When you reach Brand Analytics, click it. The page takes a moment to gather every brand's figures for the period. It compares this period with an earlier one, brand by brand. Pick a comparison. YoY sets the last twelve months against the twelve before them. Under Growth basis, choose spend, sales, profit, or margin as the measure of growth. On the right, you can see exactly which dates are being compared. The tiles add up purchase volume, sales volume, profit, and the number of active brands. Each one shows its change against the earlier period. New means there's nothing in the earlier period to compare with. Hottest Brands and Coldest Brands list the strongest growth and the steepest decline. Here every brand is new in this window, so there's no growth to rank yet. The Growth Heatmap gives each brand a row, and each month a cell. Green means growth, and red means decline, against the same month a year earlier. Hover over a cell to see both values side by side. The Brand Leaderboard ranks every brand side by side. Sort by sales volume, units, profit, margin, growth, or purchase orders. Volume hides small brands, whose percentages swing widely. Each brand gets a scorecard, and you decide how it's scored. Scroll back to the top, and click Scorecard settings. Set how much each measure counts, and the values a brand needs for each score from one to five. When you're happy with the weights and thresholds, click Save Settings, and every brand scorecard updates to match. Click the back arrow, at the top left of the page. Then scroll down, and click a brand in the leaderboard to open its own analytics page. The Brand Scorecard rates its supply from one to five, on delivery, lead time, fill rate, defects, cost, and price. The Trend chart compares this period with the last one.