Find sizes that lose sales to stockouts
In the Assortment Explorer you can add two extra column groups to any view: Stockouts & lost demand and Return reasons. Use them to see which sizes sit sold out and roughly how much they would have sold, and why customers send them back. They work with any grouping, so you can look at sizes inside one brand or category.
Before you begin
- Your products carry a size, or whatever field you want to compare. Rows with no value show as Not set.
- Stockout figures come from your stock history in SKU.io: receipts, stock counts, adjustments and sales. A product with sales but no receipts or counts has no stock history, so it gets no estimate.
- You can open reports. Admins and anyone who can view all reports can, or give a role Assortment Explorer under Report Access.
Steps
- Go to Insights → Reports and open Assortment Explorer.
- Choose the Sizes losing sales to stockouts starter view. It groups by size and puts the sizes that lost the most first.
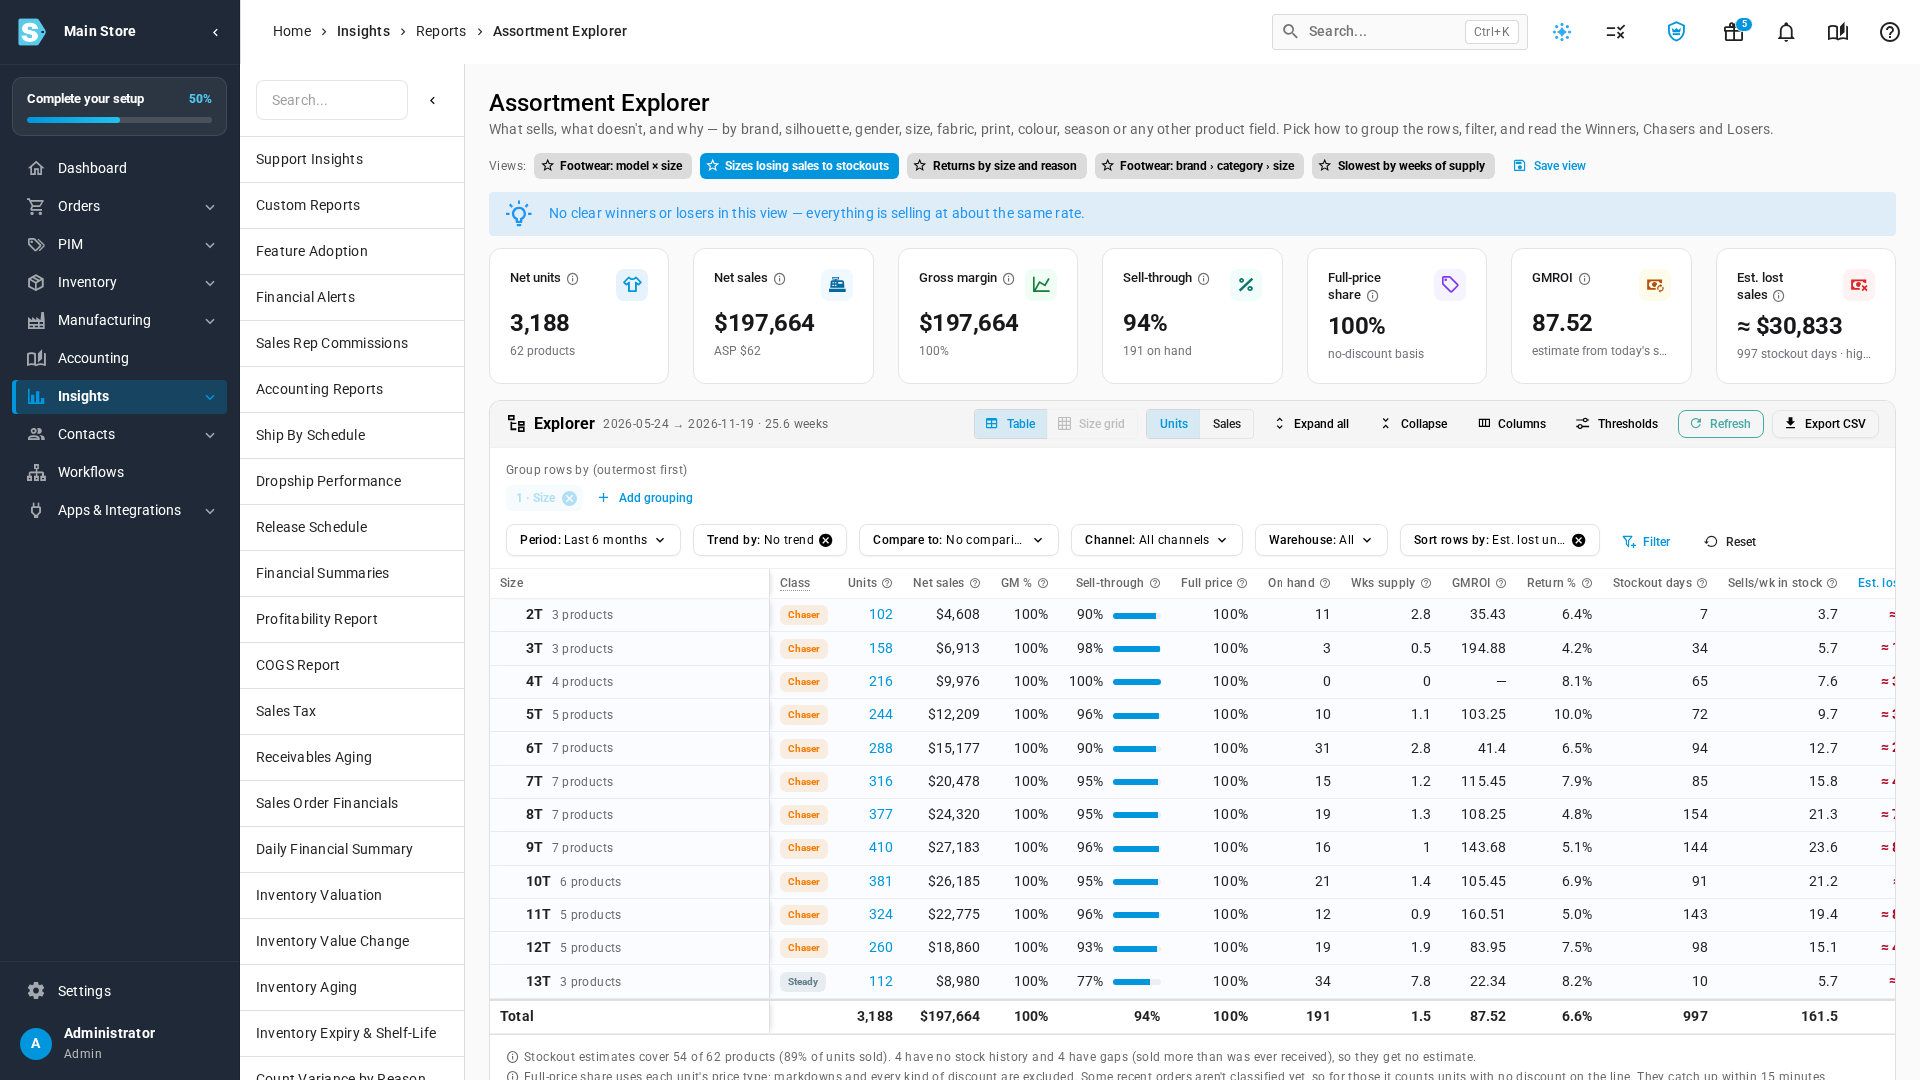
- Read the stockout columns at the right of the table:
- Stockout days: days the size was sold out, after it had first been stocked.
- Sells/wk in stock: units sold per week on the days it had stock.
- Est. lost units: the in-stock rate multiplied by the stockout days.
- Est. lost sales: the estimated lost units at the average price they sold for.
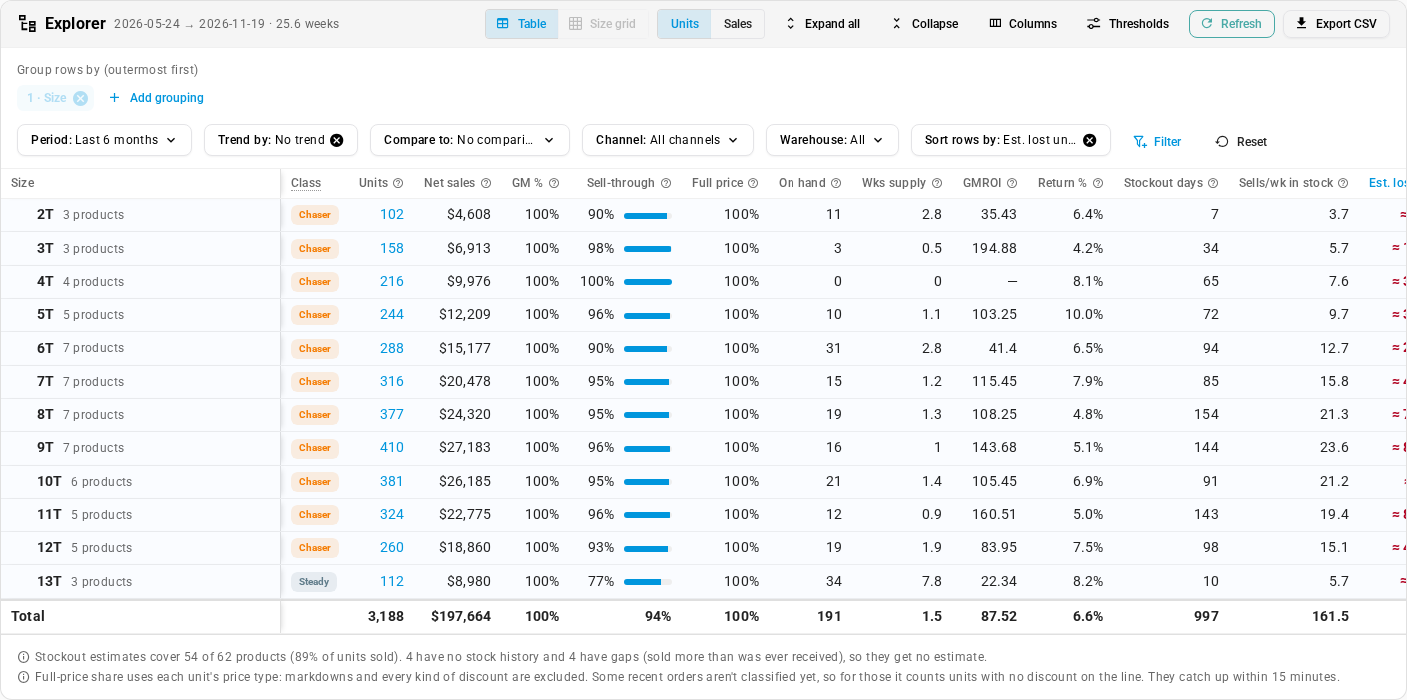
- Hover the confidence chip beside an estimate to see what it rests on. Estimates always show ≈, and they are never added to your sales totals.
- Read the note under the table. It says how many products, and what share of units sold, have a stock history. Products without one show No estimate.

- To look inside a brand or category, choose Footwear: brand › category › size, or set your own grouping with Add grouping. Each parent row adds up exactly the products under it.
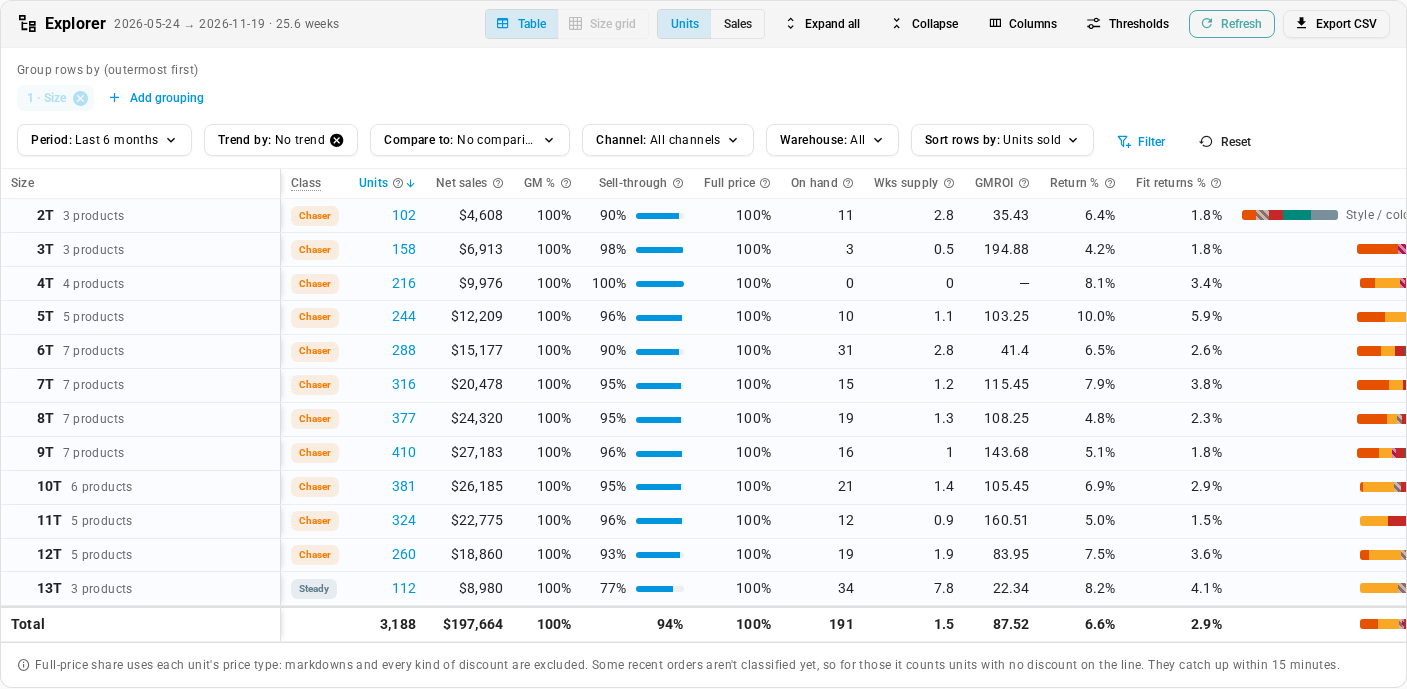
- Choose Returns by size and reason to see, for each size, the Return %, the share returned for fit (Fit returns %), and a bar of the reasons.
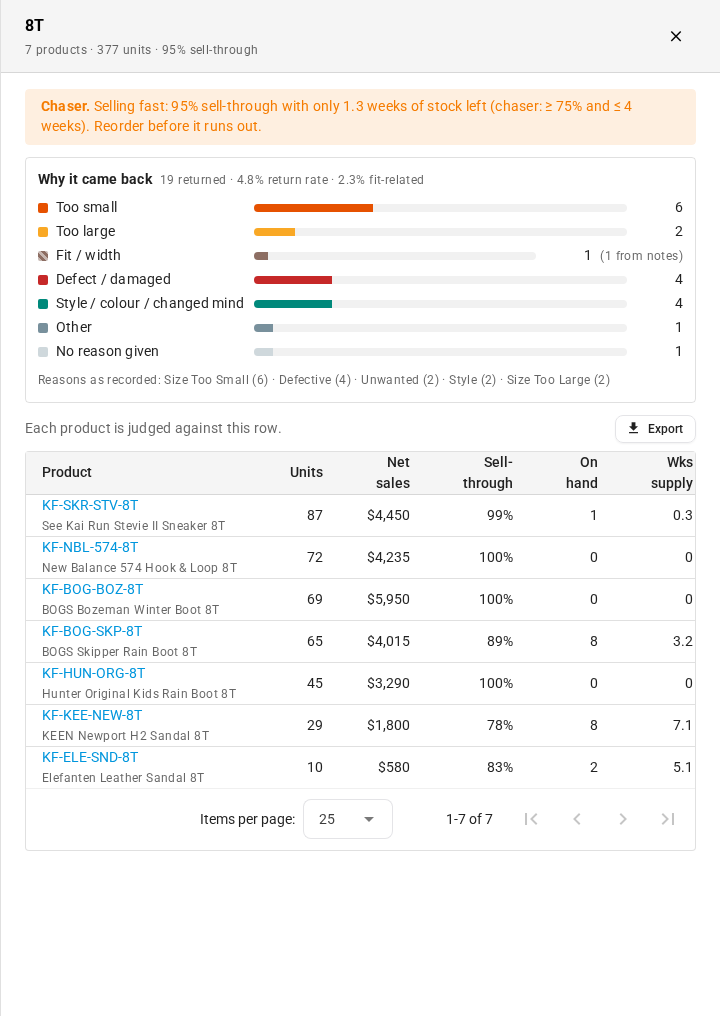
- Click a number in a row to open its breakdown. Why it came back lists every reason. Reasons read from a customer's note, and returns that aren't linked to an order, are shown separately.
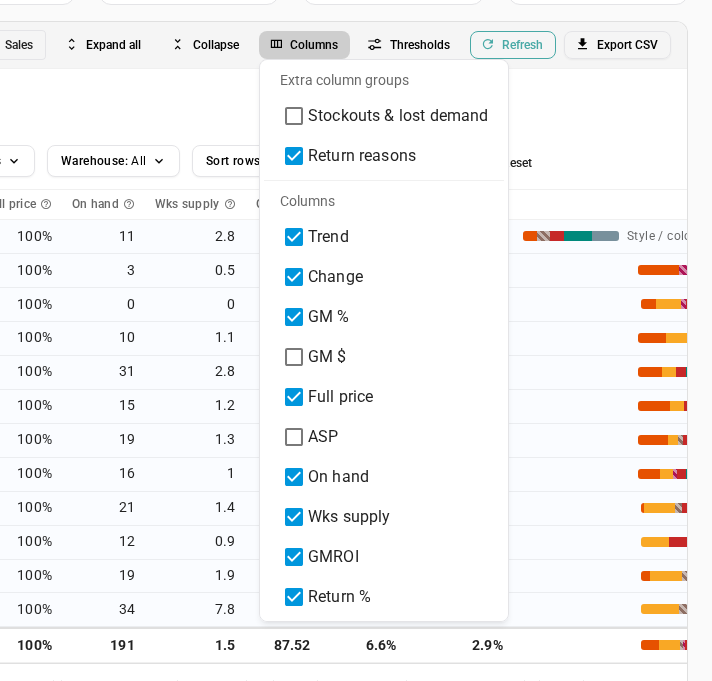
- To add these columns to any other view, open Columns and turn on Stockouts & lost demand or Return reasons. They come along when you click Export CSV.
How the estimate works
For each product in the period:
- In-stock days are days it had stock at some point. A day it sold out still counts, because it had stock that morning. Days before it was first stocked don't count at all.
- Stockout days are the days after that with nothing on hand.
- Est. lost units = units sold ÷ in-stock days × stockout days.
- Est. lost sales = estimated lost units × the product's average selling price in the period.
A row adds up the products under it. A product needs at least 14 in-stock days in the period before its rate is used, so a product received and shipped out within a day or two keeps its stockout days but gets no estimate.
| Confidence | When |
|---|---|
| High | 10 or more units sold over 28 or more in-stock days |
| Medium | 4 or more units over 14 or more in-stock days |
| Low | Fewer sales than that |
| No estimate | No stock history, a stock history with gaps (more sold than was ever received), or too few in-stock days |
A row's confidence weighs each product by its share of the lost units, and drops a level when fewer than half its products could be estimated.
How returns are counted
- Return % is units on returns raised for orders placed in the period, divided by units sold in the period. Cancelled returns and repairs don't count.
- Reasons are grouped into families: Too small, Too large, Fit / width, Comfort, Defect / damaged, Wrong item, Not as described, Style / colour / changed mind, Other and No reason given.
- When a return has no reason, or the reason is Other, the customer's note is read. If it says something like "runs narrow", the units count under Fit / width and are shown as read from the note.
- Fit returns % is the share of units sold that came back as too small, too large or for fit and width.
- Returns that aren't linked to an order count in the reasons but not in any rate, because there are no units sold to compare them with.
Next steps
- Find winners and losers with the Assortment Explorer
- Build size curves from sales
- Read the Sales by Size report
Video transcript
Start in the sidebar on the left: open the Insights menu, and then select Reports. Scroll down the list, and choose the Assortment Explorer. Across the top are its starter views. Pick the one called Sizes losing sales to stockouts, which lists every size by its estimated lost sales. Each size shows how many days it was sold out, and how fast it sells while it has stock. Multiply that rate by the stockout days, and you get the estimated lost units. The last column puts a price on them, at the average selling price. Every estimate carries a confidence flag. Hover it to see what it rests on, such as how many units sold while in stock. The note under the table says how much of your sales has a stock history. Products without one get no estimate, instead of a guess. These columns work with any grouping. The footwear starter view groups by brand first, with category and size nested inside it. Now scroll back up, and choose the starter view called Returns by size and reason. Each row shows how often it comes back, how much of that was about fit, and a coloured bar that breaks down the rest. Click a number to open the row's breakdown. The panel lists why every unit came back. Reasons that were read from a customer's note, rather than chosen as a reason, are shown separately, so you can tell them apart. When you have read it, close the panel with the X in its top corner. In any view, you can turn these column groups on, under Columns. Stockouts and lost demand is one group, and Return reasons is the other. They come along when you click Export CSV, so the download matches the table you see.