Check your books against Xero or QuickBooks
The books health check compares SKU.io's own figures with the trial balance in your Xero or QuickBooks Online books, month by month. It works through four sections in order: income, income by channel, cost of goods sold, and the balance sheet (inventory, inventory in transit and vendor deposits). Each section gets a grade for how far apart the two sides are, with a trust level beside it, so you and your accountant can see where to look first.
The health check only reads your books. It never posts, changes or approves anything in them, and it's free: it uses your own accounting connection.
Before you begin
- Connect Xero or QuickBooks Online. See Connect Xero or Connect QuickBooks Online.
- Your books and SKU.io must use the same base currency. When they don't, the run stops and says which currencies it found.
- Permissions come from your role, under Accounting in Settings → Users & Permissions → Roles. To read results and run history you need List. To run a check or export results you need Sync. To change the bands, the footer or the account-to-channel map you need Manage Settings.
- The grades lean on how far your costs and counts can be trusted. See Check how far your costs and counts can be trusted.
Run the health check
-
Go to Accounting, and select Health check under Period end.
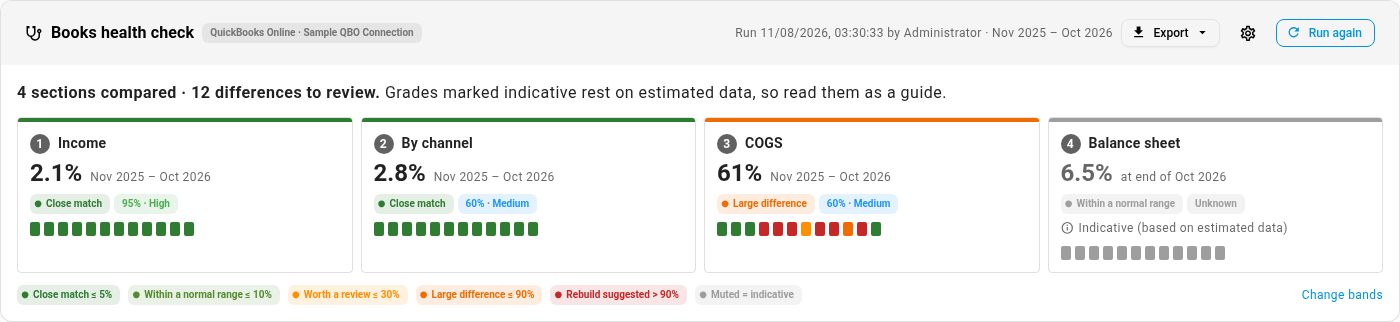
The page opens on the latest run. The summary shows one tile per section, with its difference, its grade and its trust level, and a strip with one block per month.
-
Select Run again (or Run health check the first time), and choose the months in From and To. Last 12 months, This year and Last year fill them in for you. A run covers up to 24 months, ending no later than this month.
The form shows how many reads the run needs from your books: one trial balance per month end, plus your base currency. Month ends an earlier run already read are reused, so a repeat run needs fewer.

-
Select Run health check.
A run usually takes a few minutes. You can leave the page; its progress shows in the job tray, and the results appear here when it finishes.
If your connection needs signing in again partway through, the run stops and keeps the months it already read. Reconnect, then select Resume to carry on from where it stopped.
Read the grades
Each difference is graded against your bands:
| Grade | Default limit | What it suggests |
|---|---|---|
| Close match | up to 5% | The two sides agree. |
| Within a normal range | up to 10% | Usually timing or small items. |
| Worth a review | up to 30% | Look at the months that stand out. |
| Large difference | up to 90% | Something is posted differently or missing. |
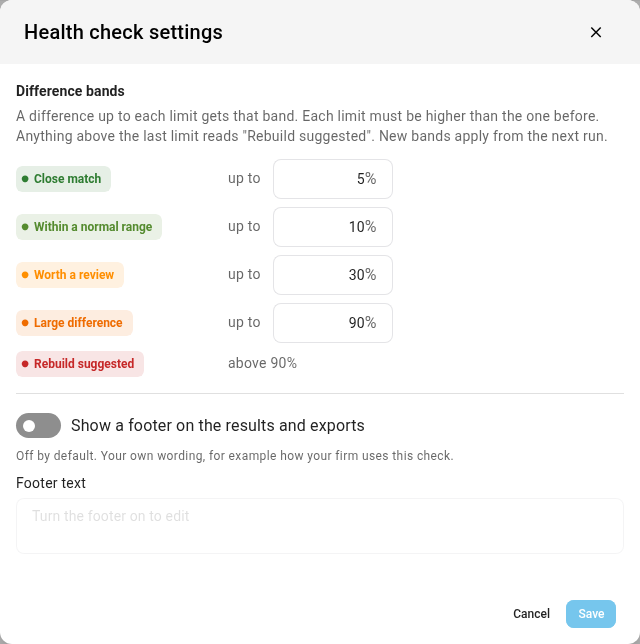
| Rebuild suggested | above 90% | The figures are too far apart to reconcile month by month. |
Beside each grade is a trust level: High, Medium, Low, Estimate or Unknown, with its percentage. It shows how far SKU.io's own figure can be trusted, from your cost and count trust. A grade that rests on estimated data is marked Indicative, and its tile and chip are greyed, so read it as a guide.
To change the limits, see Change the bands and the footer.
Review income
Income and chart of accounts compares SKU.io's revenue, net of refunds and by order date, with your income accounts, month by month.
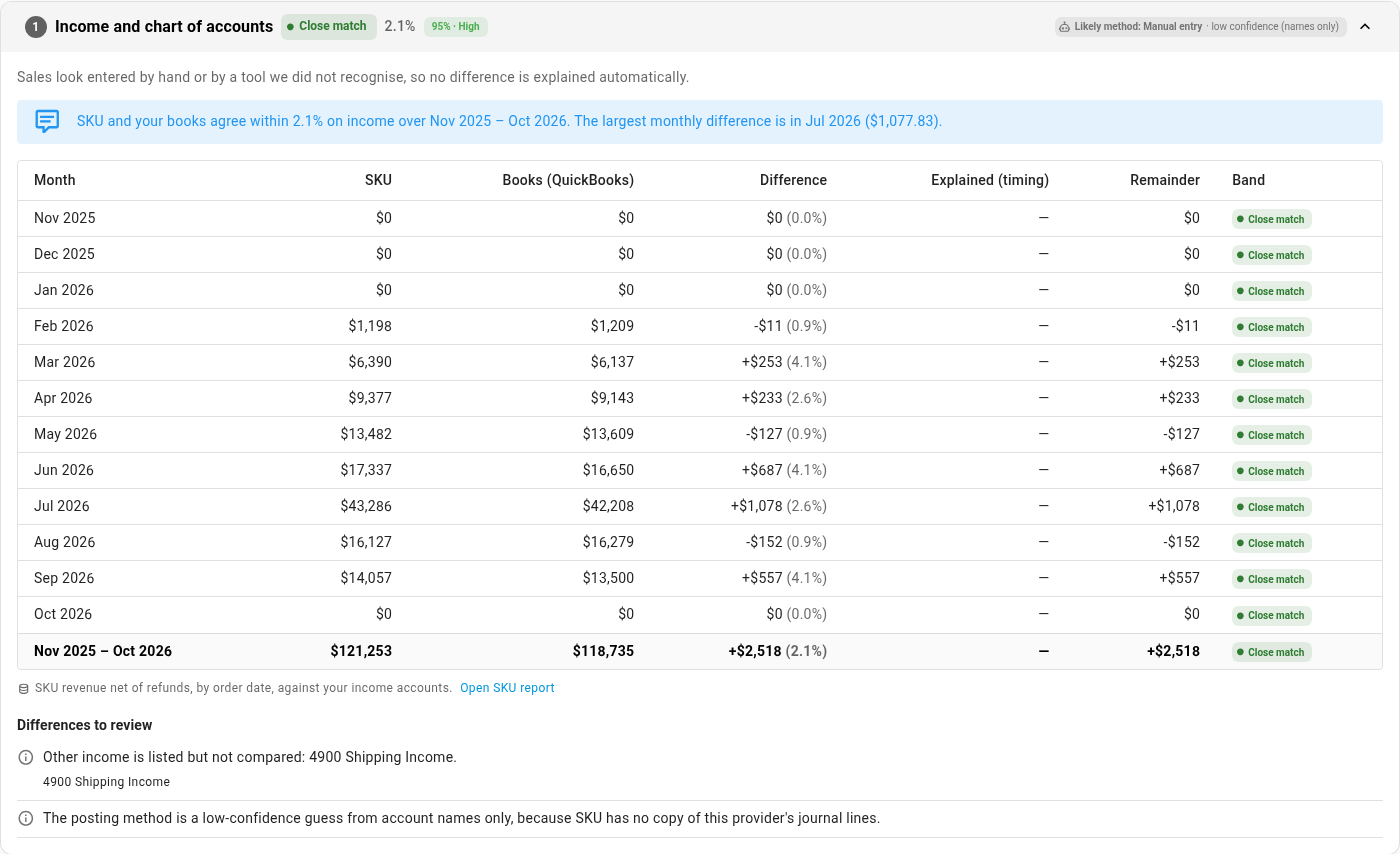
- Likely method names how your sales most likely reach your books: through SKU.io, A2X, Synder, Webgility, by hand, or a mix. With QuickBooks it's a guess from account names, marked low confidence.
- Explained (timing) applies when your sales are posted by A2X. A2X posts on payout dates, so a difference that reverses in the next month is timing, not a gap. Remainder is what's left after timing.
- Differences to review lists what else it noticed, such as other income it didn't compare, or a clearing account that keeps growing month after month.
- Open SKU report opens the SKU.io report the figure comes from.
Review income by channel
By channel lists each sales channel's revenue, cost of goods sold, gross profit and contribution margin. Select a channel to see it month by month.
Your books can be compared channel by channel only where a channel has its own income account. A channel whose income shares an account with others reads Books do not split this channel, and it isn't graded on its own.
To tell SKU.io which income account holds which channel:
-
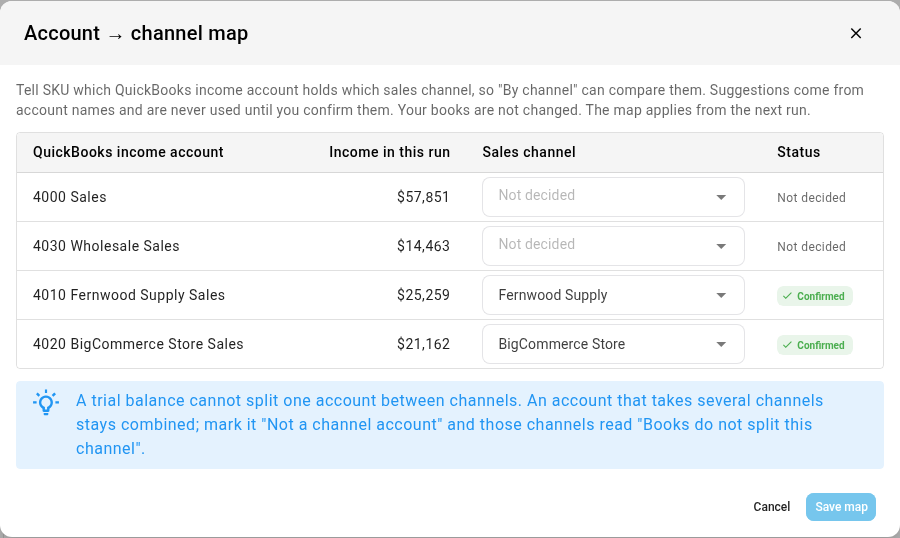
Select Account → channel map.
-
For each income account, choose its Sales channel. Suggestions come from account names and aren't used until you confirm them. For an account that takes several channels, choose Not a channel account.
-
Select Save map.
The map applies from the next run.
Review cost of goods sold
COGS compares SKU.io's cost of goods sold, the same figure as the Inventory COGS report, with the accounts SKU.io posts cost of goods sold to.
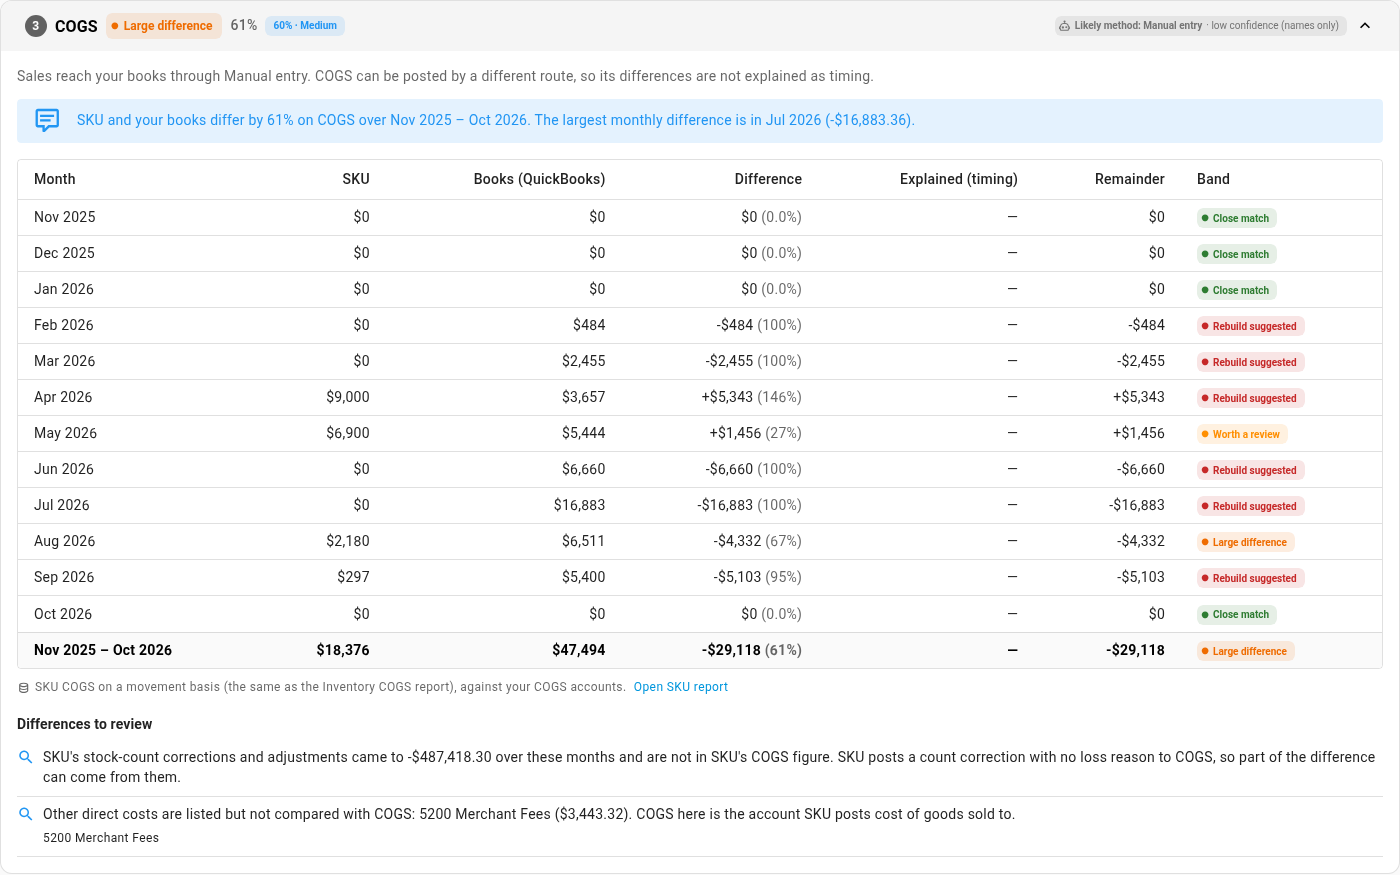
Read Differences to review under the table. It points at what can explain a gap, such as stock count corrections that aren't in SKU.io's COGS figure, or other direct costs (merchant fees, shipping) in your books that it lists but doesn't compare. A COGS difference is never explained as timing, even when your sales are posted by A2X.
When the difference is large and SKU.io's own costs aren't yet well evidenced, the section offers a cost check run by the SKU.io team. It compares your product costs with supplier invoices, landed-cost bills and counts, so you know which side to correct.
Review the balance sheet
Balance sheet compares inventory, inventory in transit and vendor deposits at the last month end of the run, then inventory at every month end.
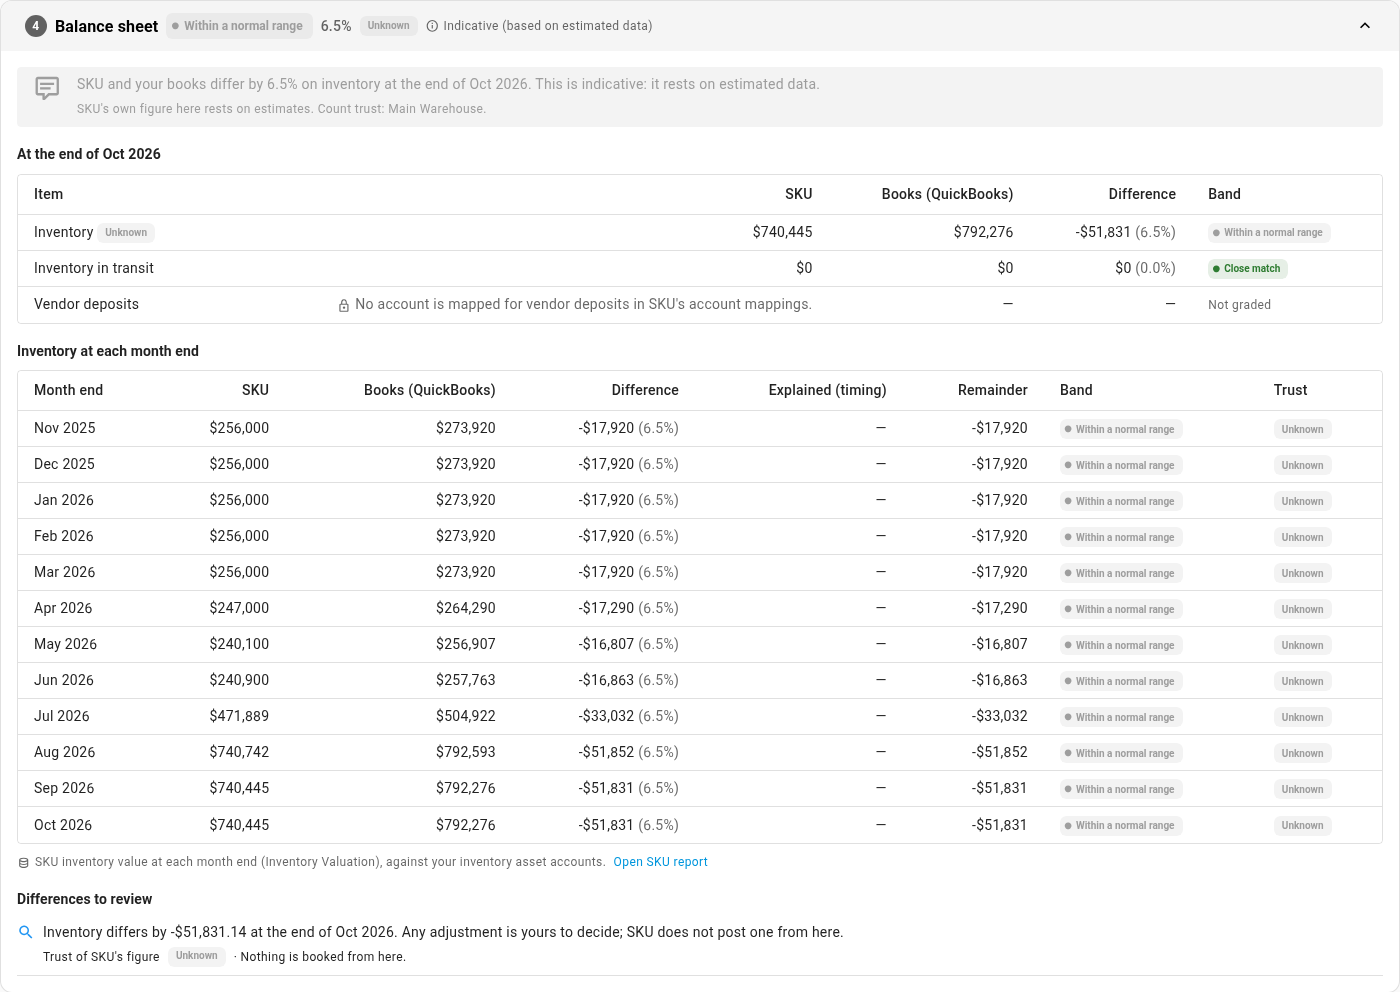
- Inventory is read from the accounts you earmarked for the inventory reconciliation. When none are earmarked, it's read from your books' inventory accounts.
- Vendor deposits is compared only when an account is mapped for them in your account mappings; otherwise it reads Not graded.
- Any adjustment is yours to decide. The health check doesn't post one.
Share the results
- Select Export, then choose:
- XLSX: every month and difference, for the full detail, or
- PDF: a summary to share with your accountant.
- Download the file from the job tray when it's ready.
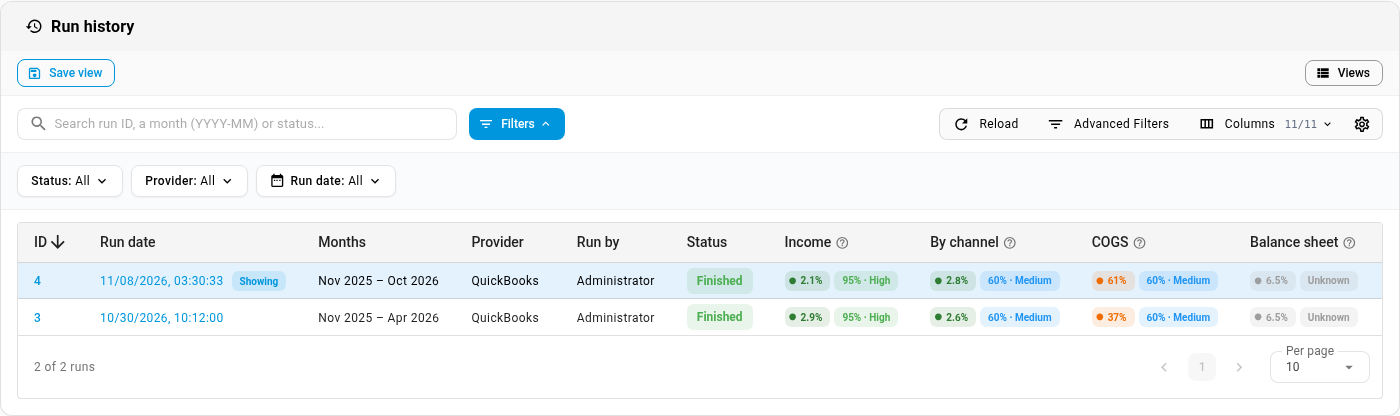
Run history at the bottom of the page lists every run, with its months, provider, status and the grade of each section. Select a run's date to read it again; the run on screen is marked Showing.
Change the bands and the footer
-
Select the settings icon beside Export.
-
Under Difference bands, enter the limit for each grade. Each limit must be higher than the one before.
-
To add your own wording to the results and exports, such as how your firm uses this check, turn on Show a footer on the results and exports and enter the Footer text. It's off by default.
-
Select Save.
New bands apply from the next run.
Next steps
- Check how far your costs and counts can be trusted
- Read the ecommerce P&L
- Reconcile inventory to your accounting provider
Video transcript
Start from the dashboard, and open Accounting. Then, under Period end, select Health check. It compares your figures here with the trial balance in your books, in four sections. Each section gets a grade, with a trust level beside it.
To run it, select Run again and choose your months. The form shows how many reads it needs from QuickBooks. It only reads from your books, and never writes to them. When you're ready, select Run health check, and follow it in the job tray.
For now, cancel, and read the latest run. Income comes first. Each month shows your revenue here, the figure in your books, and the difference, graded against your bands. The section also names the method your sales most likely reach your books by.
By channel shows the revenue, cost of goods sold and margin of every sales channel. Where your books keep a channel on its own income account, the two sides are compared.
Your books don't say which sales channel each income account belongs to, so you link them yourself. Open the account to channel map, which lists the income accounts your books report. Pick a channel for each one. If an account mixes several, choose Not a channel account instead. Then save the map, and your next run uses it.
Next, cost of goods sold. Here the gap is large, so read the differences to review below the table. They point at what can explain it, such as stock count corrections.
Last, the balance sheet compares inventory, inventory in transit and vendor deposits at the last month end. Grades that rest on estimated data are marked indicative, so read those as a guide.
To change where each grade starts, select the settings icon. Set your own limits here, and add a footer to the results and exports if your firm wants one.
To share the results with your accountant, select Export, and choose a spreadsheet with every month, or a PDF summary. Earlier runs are kept in the run history, at the bottom of the page.