Read the ecommerce P&L
The Ecommerce P&L puts the figures an ecommerce accountant asks for into one report: revenue and cost of goods sold by month, the same split by sales channel, inventory at each month end beside your books, and how far each month's figures can be trusted. You can export all four tabs as an Excel workbook to hand to your accountant.
Before you begin
- You need sales orders in the months you want to read. Months with no sales show zeros.
- To see the Ledger basis and the Per the books rows, SKU.io must be generating accounting entries. See Review the ledger.
Open the report
- Go to Accounting → Reports → Ecommerce P&L.
- Choose the months to show in From and To. The report covers up to 36 months and starts on the last 12.
- Leave Basis on Auto unless you want every month read one way (see below).
Read the P&L by month
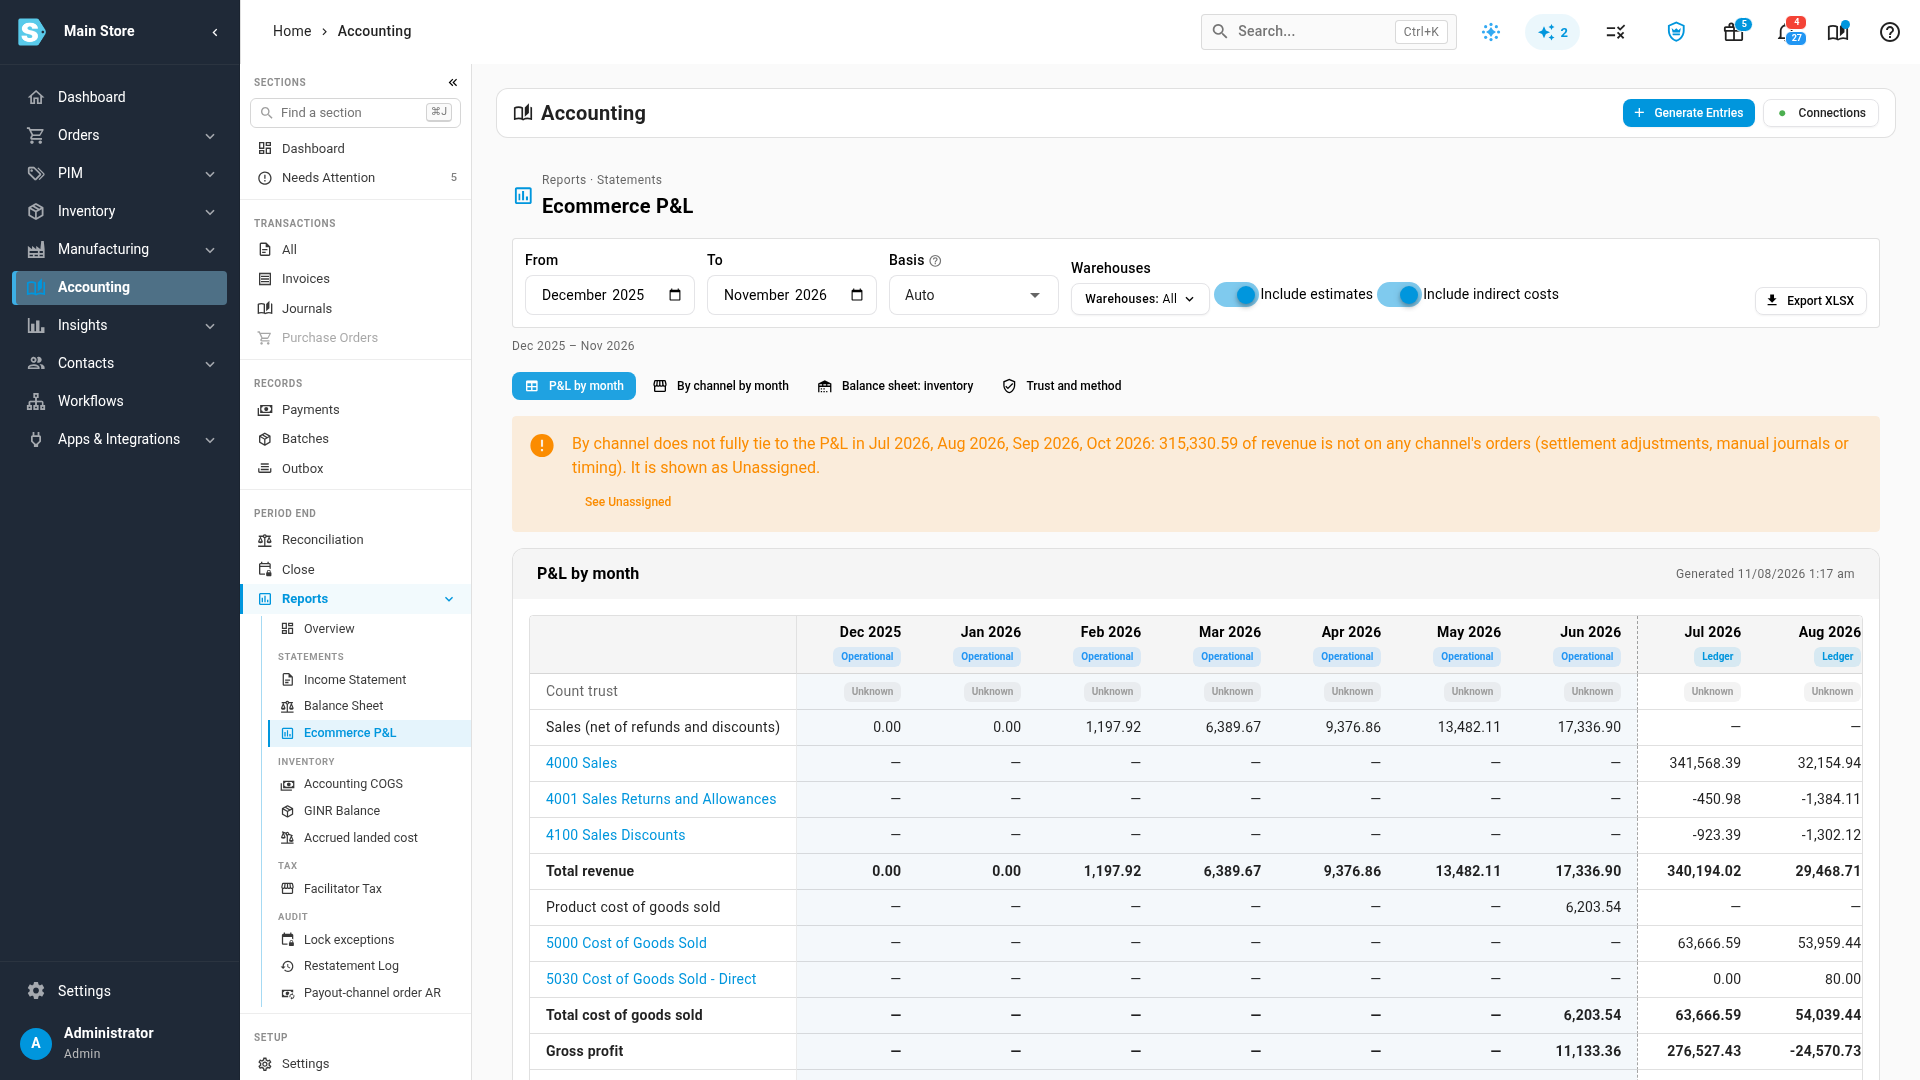
The P&L by month tab runs from revenue down to gross profit, one column per month and a Total column at the end.
- Total revenue is your sales net of refunds and discounts.
- Total cost of goods sold is the cost of the units you sold, less the cost of returns.
- Gross profit and Gross margin % follow from the two.
- On months read from your orders, Order costs (fees, shipping) and Profit after order costs appear below gross profit.
Where each month comes from
Every month carries a chip under its name that says where its figures come from:
| Chip | Where the figures come from |
|---|---|
| Operational | Your sales orders and stock movements. Used before SKU.io starts posting your accounting, and for any month you choose to read this way. |
| Ledger | The entries SKU.io posts to your books. Revenue and cost of goods sold show one row per account. |
| History | Months before your inventory start date, from the history you recorded before going live. |
| Estimate | As History, but SKU.io estimated the month. Estimates are never posted. Turn off Include estimates to hide them. |
With Basis on Auto, a month reads Ledger once SKU.io generates entries and your accounting start date is on or before the first of that month. Otherwise it reads Operational. A dashed line marks the month the basis changes.
The Count trust row under the month names shows how far each month's inventory figures can be trusted, for the warehouse with the weakest records. Point at a chip to see every warehouse. See Check how far your costs and counts can be trusted.
Read it by channel
- Select By channel by month.
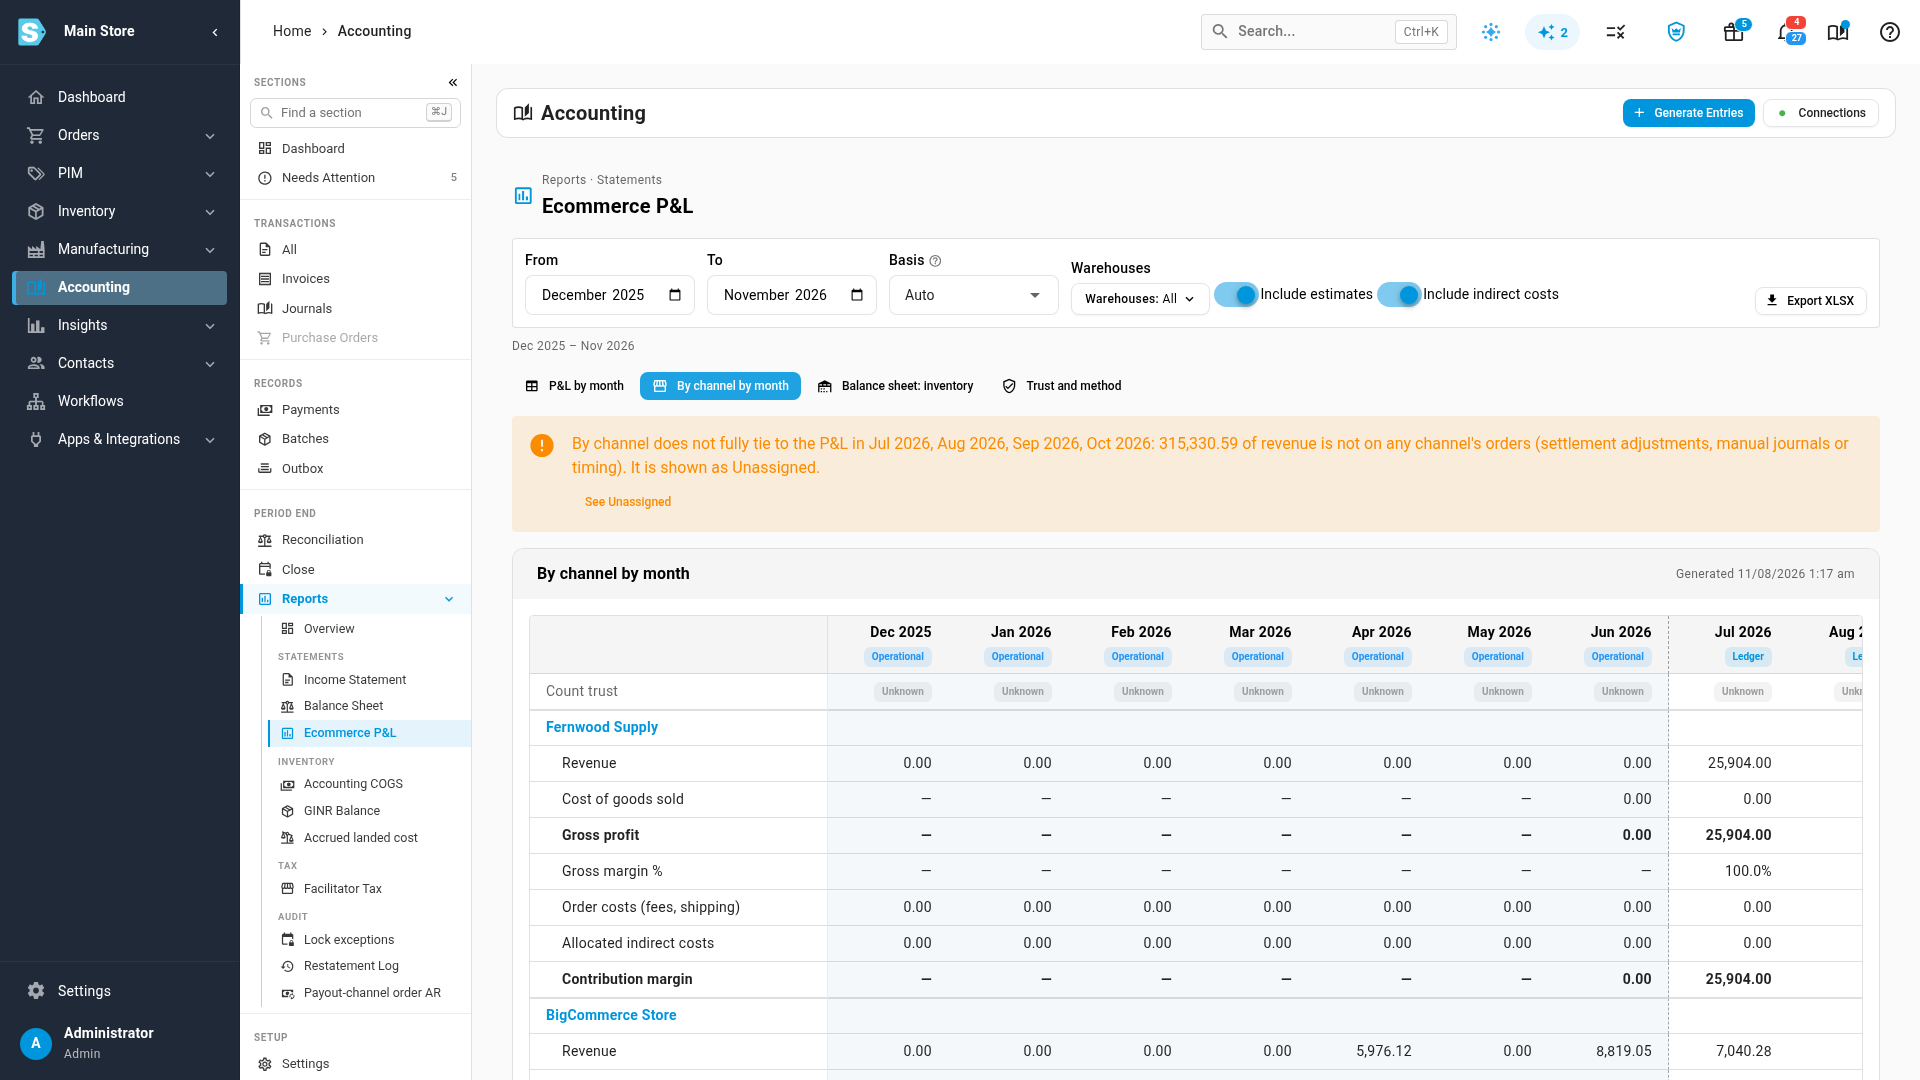
- Each sales channel has its own block: Revenue, Cost of goods sold, Gross profit, Gross margin %, then Order costs (fees, shipping), Allocated indirect costs and Contribution margin. Turn off Include indirect costs to stop at gross profit.
- Channels are listed from highest revenue to lowest. Select a channel's name to open its Contribution Margin report.
The Unassigned channel
Channel revenue always comes from your sales orders, because a sales channel is something an order has. On Ledger months, your books can hold revenue that no order explains: a settlement adjustment, a manual journal, or a sale booked in a different month. That difference goes to the Unassigned channel block, so the channels plus Unassigned always add up to the P&L by month tab. Cost of goods sold that no channel can claim, such as a stock count adjustment, lands there too.
When Unassigned revenue is more than 0.5% of a month's revenue, a banner names those months. Select See Unassigned to jump to the block. The Tie-out to the P&L rows at the bottom show the amount and percentage for every month.
Check inventory against your books
- Select Balance sheet: inventory. It takes a moment to load, because it values your inventory at every month end.
- Each warehouse shows On hand, In transit, Inbound (open purchase orders) and Invoiced, not yet received, with a total for each. Open vendor deposits shows the deposits you have paid and not yet used, as at each month end.
- On Ledger months, Per the books shows your inventory, inventory in transit and vendor deposit accounts. Inventory counts every inventory account your products and warehouses post to.
- The Difference row compares your inventory (on hand plus in transit) with the books. A difference over 1.00 is highlighted. See Reconcile inventory to your accounting provider to track one down.
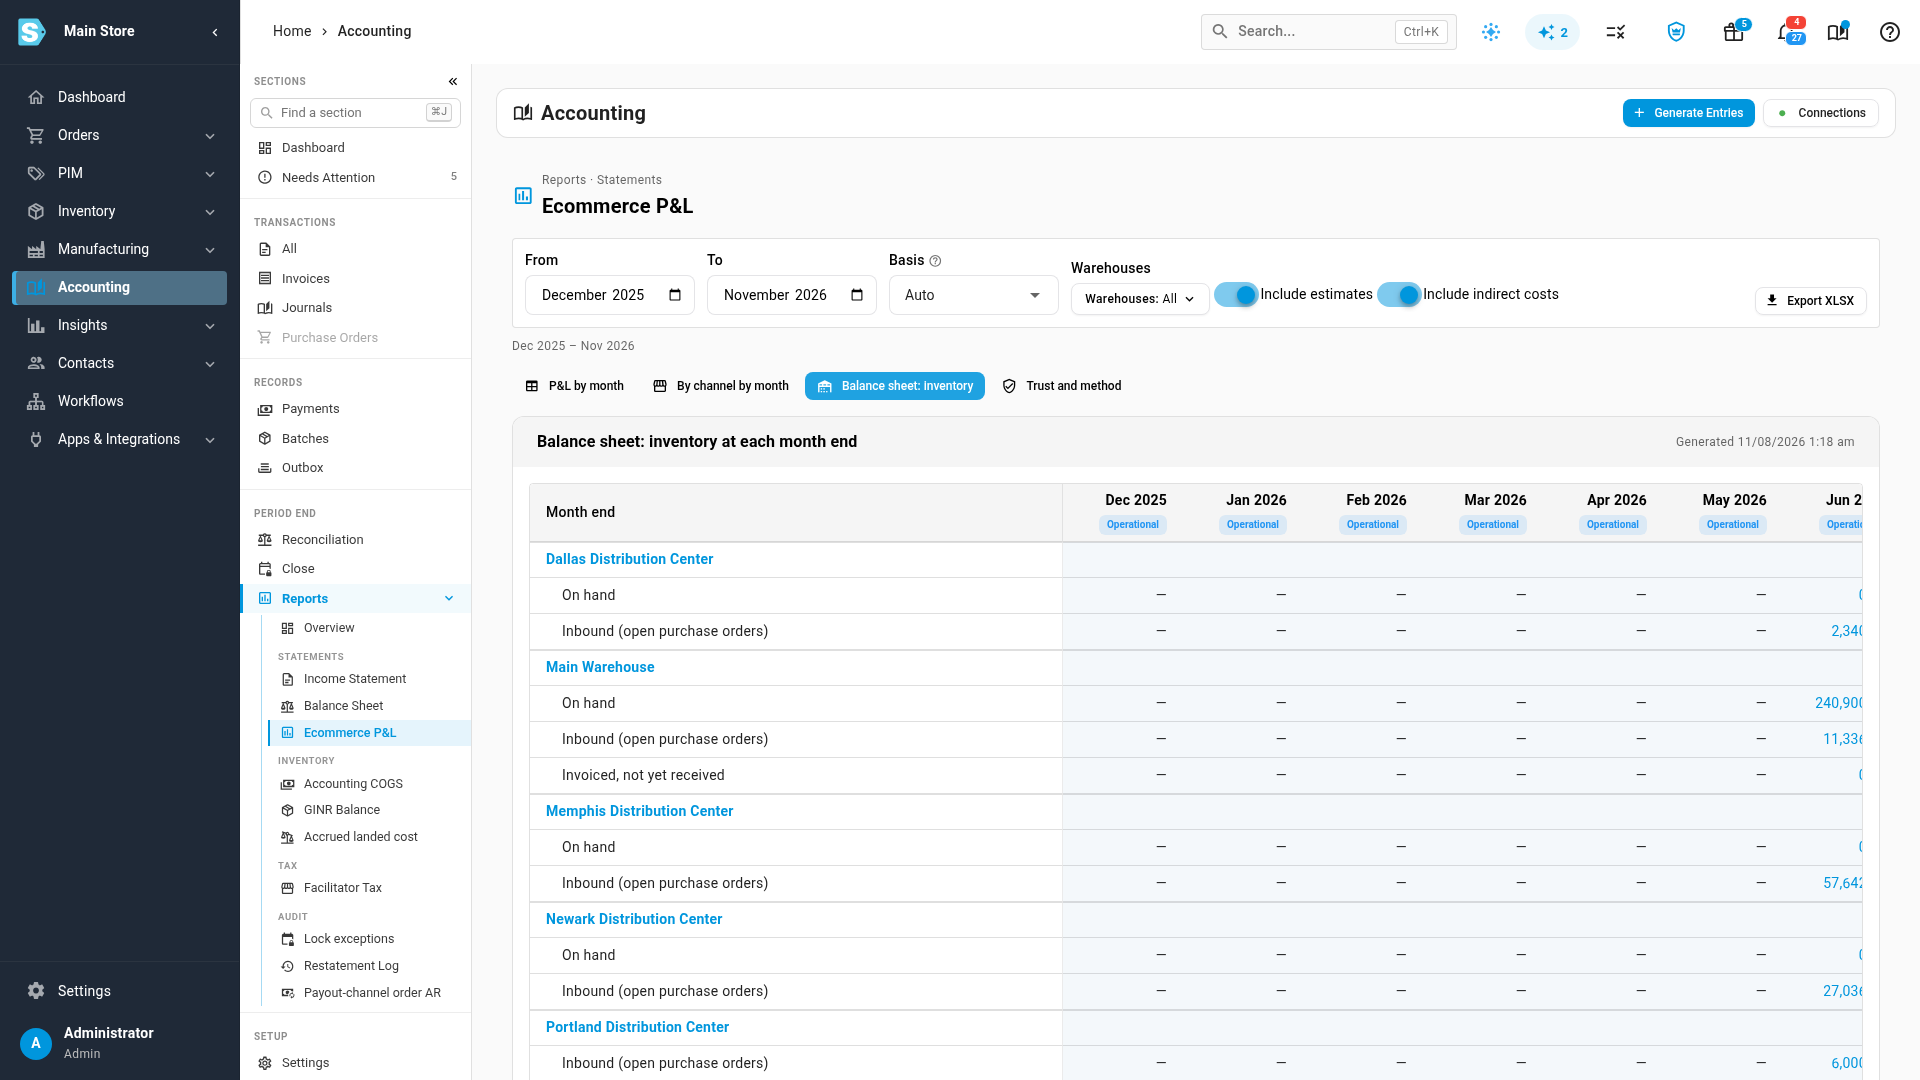
When you choose warehouses in Warehouses, the balance sheet and count trust narrow to them, but the books hold one figure for all warehouses, so the Difference row is hidden. Revenue and cost of goods sold always cover every warehouse.
Check trust and export
- Select Trust and method. Each month shows its basis, cost trust, count trust, the weakest warehouse, whether it includes estimates, and its Unassigned revenue. The Method card below explains each basis and how the figures are worked out.
- Select Export XLSX. The workbook builds in the background. Download it from the job tray when it finishes.
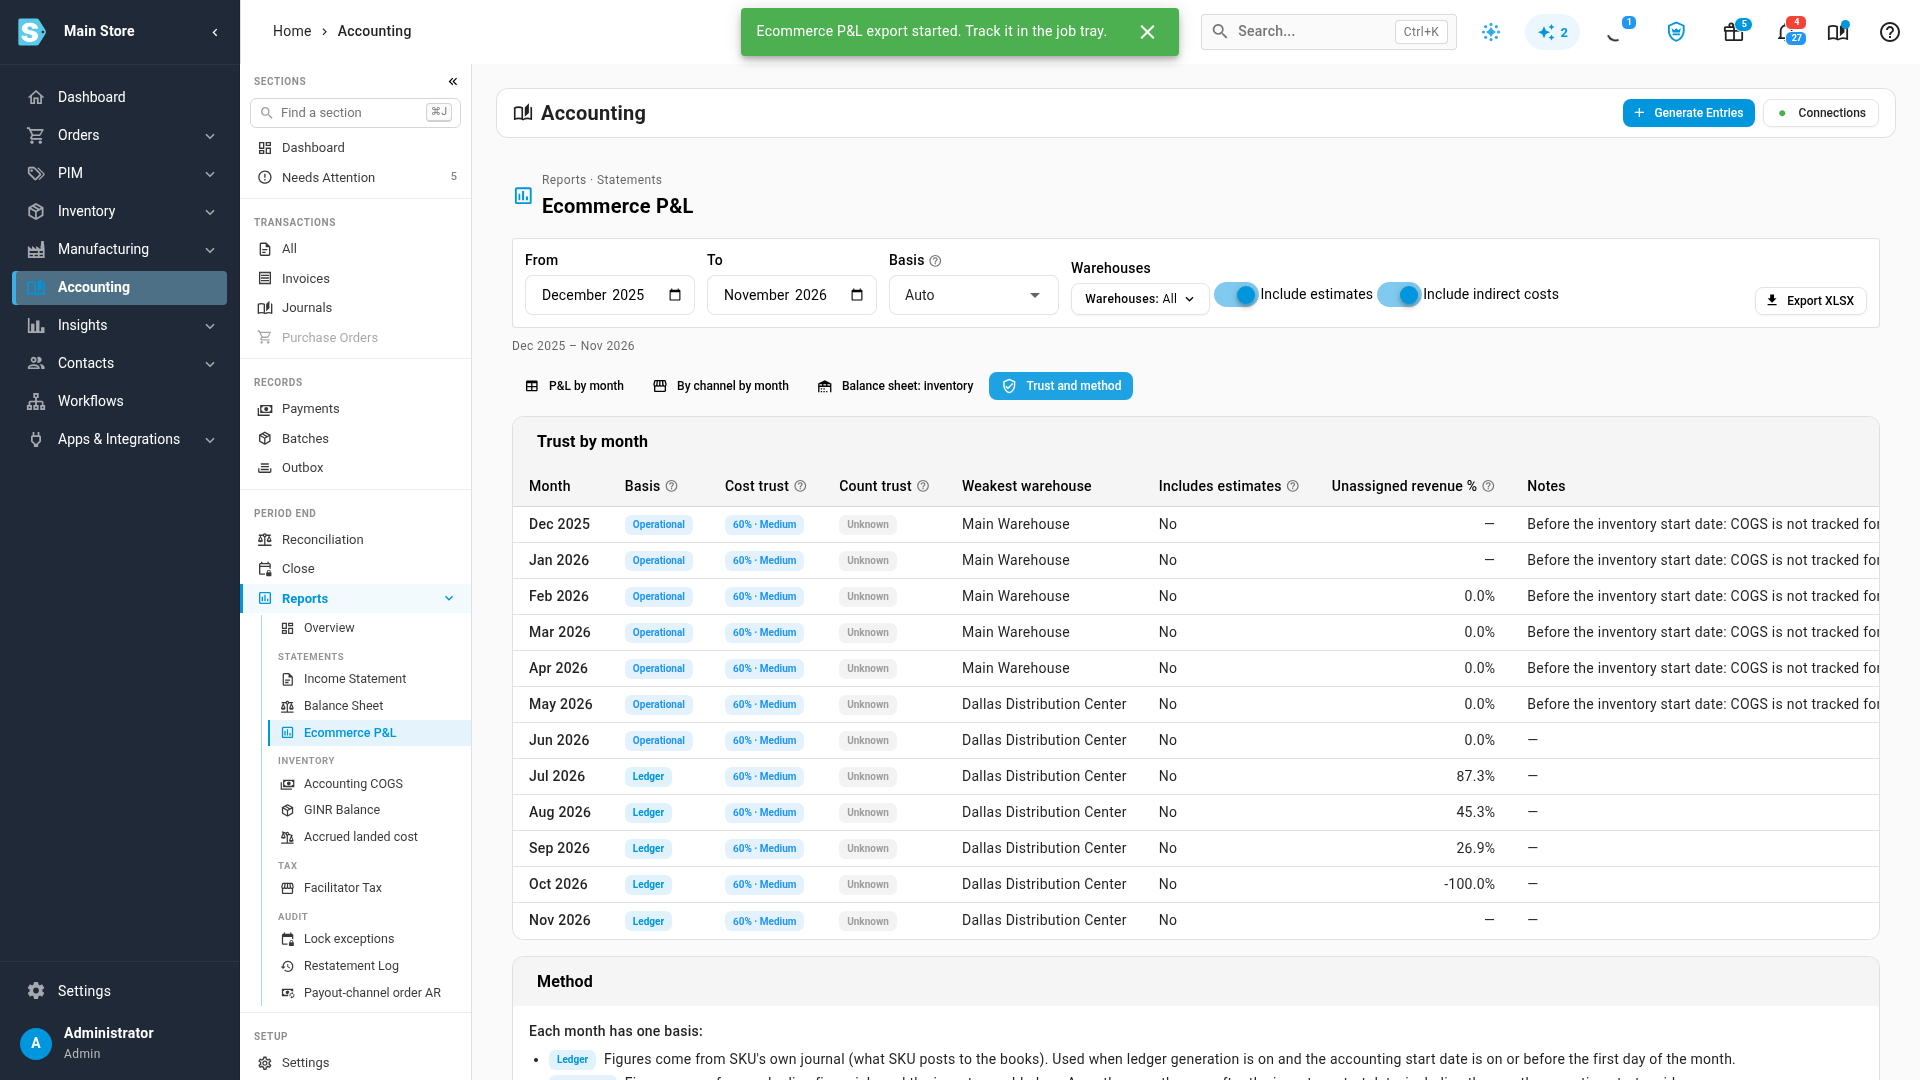
The workbook has the same four tabs as the screen: P&L by month, By channel by month, Balance sheet - inventory and Trust and method. Every month column carries its basis and its trust, and Estimate months are shaded grey.
Months before your inventory start date, with no recorded history, show revenue but no cost of goods sold: SKU.io didn't track stock then. The same applies to the month your inventory start date falls in, when it isn't the first of the month. Gross profit and margin are blank for those months, and so are the range totals that would include them, rather than showing a margin that isn't real.
Related reports
- In the COGS report, turn on Split by month to add a net cost of goods sold column for each month.
- Financial Summaries can now show COGS and Gross Profit for any grouping, including sales channel.
Next steps
- Check how far your costs and counts can be trusted
- Read your financial statements
- Reconcile inventory to your accounting provider
Video transcript
The ecommerce P&L lays a year of sales and cost of goods sold side by side. Revenue runs down to gross profit and gross margin, month by month. A chip under each month names its source. Operational columns use your sales orders. Ledger ones use your posted accounting entries. Select By channel by month to split the same figures by where you sell. Each storefront gets its own block, down to contribution margin. Scroll down past the channels to the Unassigned block. Anything your orders don't explain lands here, so the channels always add up to the P&L. Scroll back to the top of the report, and select Balance sheet. It takes a moment to load, because it values your stock at the close of every month in the range. Per the books shows your inventory accounts alongside those figures. The difference row shows where the two disagree. Trust and method lists each month's basis, and how far its figures can be trusted. Select Export to download all four tabs as one workbook, ready for your accountant.