Video chapters: 0:00 Open the report · 0:23 Read the age buckets · 0:36 Focus on one bucket · 0:51 Check the trend · 1:08 Read a product row · 1:25 Spot FBA surcharges · 1:38 Open a product's details · 1:52 Record what you did · 2:03 Save the action · 2:19 Work through the queue · 2:29 Fix it at the source · 2:47 Get the weekly digest
Find and clear aged inventory
The Inventory Aging report shows how long your stock has been on hand, valued at cost, and what holding the old stock is costing you. It's also a workbench: you record what you did about each aged product, so the team can see what's in progress, and the trend shows whether the clearance effort is working.
Before you begin
- Your role needs access to the Inventory Aging report under Report Access.
- To record, resolve or accept actions, your role needs the inventory permission to manage aging actions. Admins have it by default.
- Age is measured from the date of each batch of stock (each FIFO layer), so the report is only as good as your receipt dates. See FIFO layers and COGS.
Open the report
- Go to Insights → Reports.
- Choose Inventory Aging from the list of reports.
The page opens on every warehouse, with the products that need attention listed first.
Read the age buckets
The strip across the top splits the value of your stock, at cost, into six age buckets: 0-30 days, 31-60 days, 61-90 days, 91-180 days, 181-365 days and 365+ days. Each card shows the value and the number of units in that bucket. The line above the cards gives the number of SKUs, the total value at cost and the average age.
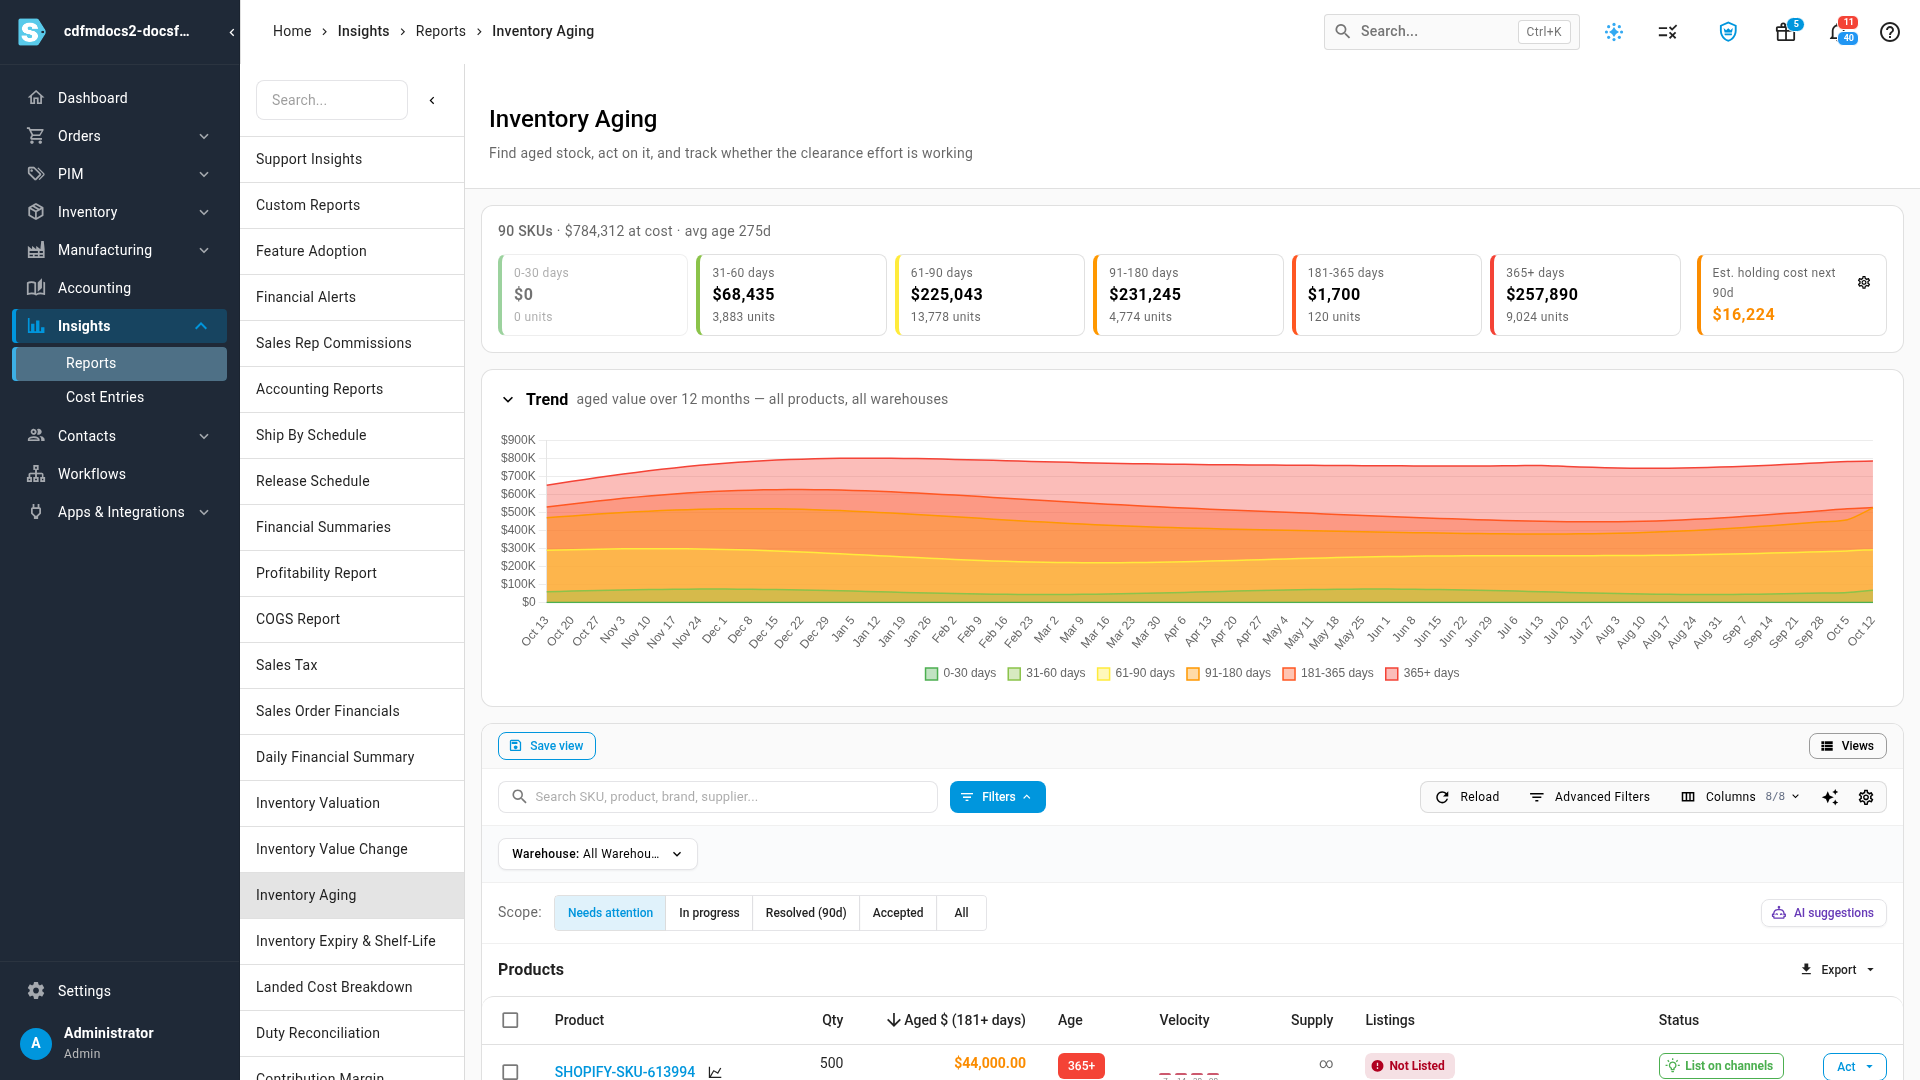
The last card, Est. holding cost next 90d, estimates what it costs to keep your aged stock (181 days and older) for another 90 days: aged value × your annual carrying cost ÷ 4. To change the carrying cost, click the gear on that card, enter your Annual carrying cost (%), and click Save. The default is 25%.
To focus on one bucket, click its card. The product list narrows to stock in that bucket, and the aged-value column counts only that bucket. Click the same card again to go back to everything.
Check the trend
Under the buckets, Trend charts your stock value over the last 12 months, stacked by age bucket. A shrinking band of old stock means your clearance work is paying off. Once there's enough history, the chart opens on its own; click Trend to fold it away or open it again. It follows the Warehouse filter, and it's built from a snapshot SKU.io takes every night, so a new account fills it in over time.
Read a product row
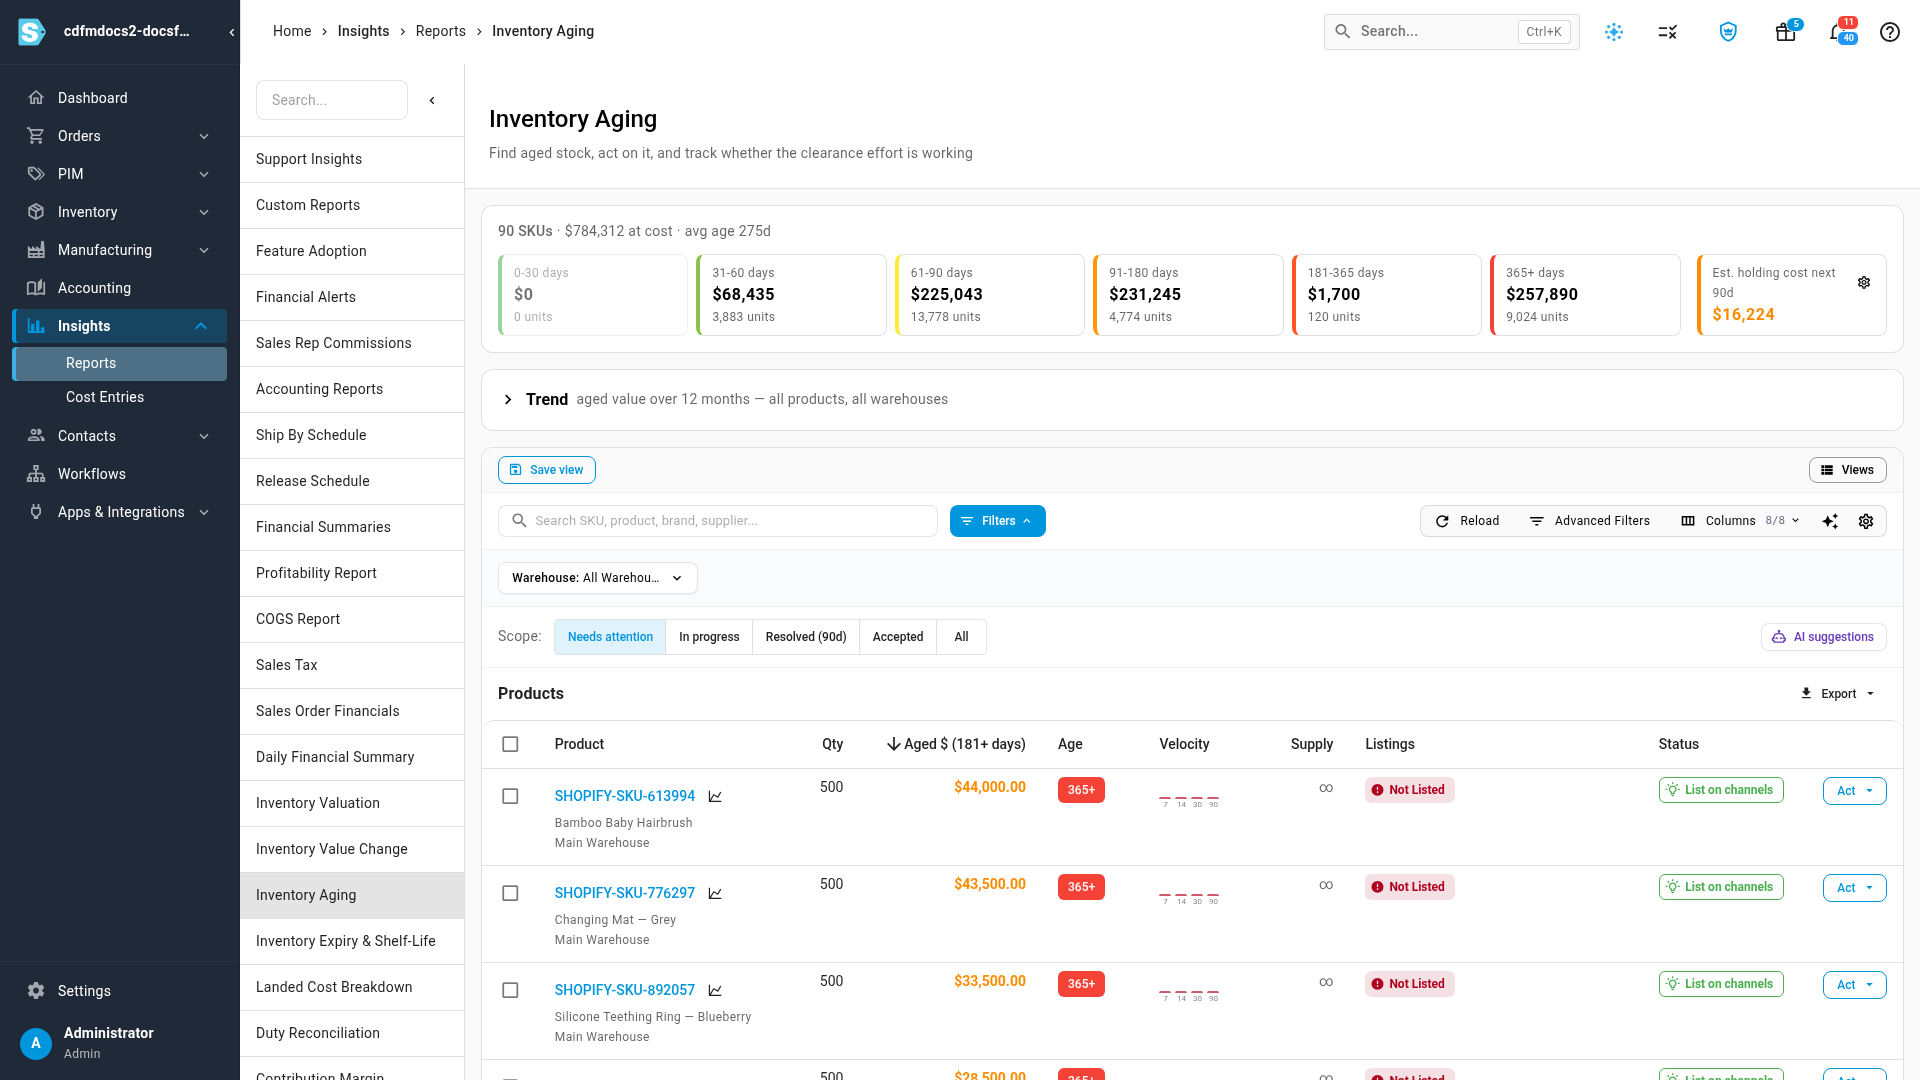
Below the strip, each product gets one row, with the most aged value first.
| Column | What it shows |
|---|---|
| Product | The SKU, name and the warehouses holding it. The chart icon opens the product's sales history. |
| Qty | Units on hand across the warehouses in view. |
| Aged $ (181+ days) | The value of the product's stock that's 181 days or older, with its total value underneath. When you've clicked a bucket, the heading names that bucket instead. Stock held at Amazon also shows an FBA fee chip here (see below). |
| Age | The bucket of the product's oldest stock. |
| Velocity | Units sold over the last 7, 14, 30 and 90 days. |
| Supply | How many days the stock lasts at the current sales rate. ∞ means it hasn't sold. |
| Listings | The channels the product is listed on, with each listing's price. Not Listed means buyers can't see it anywhere. |
| Status | The suggested next step, such as List on channels, Expand channels or a price cut, until you record an action. After that it shows the action's state. |
Use the search box to find a product by SKU, name, brand or supplier, and the Warehouse filter to look at one location. Advanced Filters and the AI filter narrow the list further, and Save view keeps a filter set for next time.
AI suggestions scores your aged products in the background and replaces the rule-based suggestions in the Status column when the job finishes. It falls back to the rules when AI is turned off.
Spot FBA aged-inventory surcharges
Amazon charges a monthly aged-inventory surcharge on stock that has sat in its fulfillment centers for more than 180 days, and the rate climbs in tiers as the stock gets older. When a product has stock at Amazon, its row shows an FBA fee chip under the aged value:
- FBA fee $58.00/mo means some of its FBA units are already past a surcharge tier, and this is roughly what they cost each month.
- FBA fee cliff with a date means no units are being charged yet, but some cross into the first tier on that date.
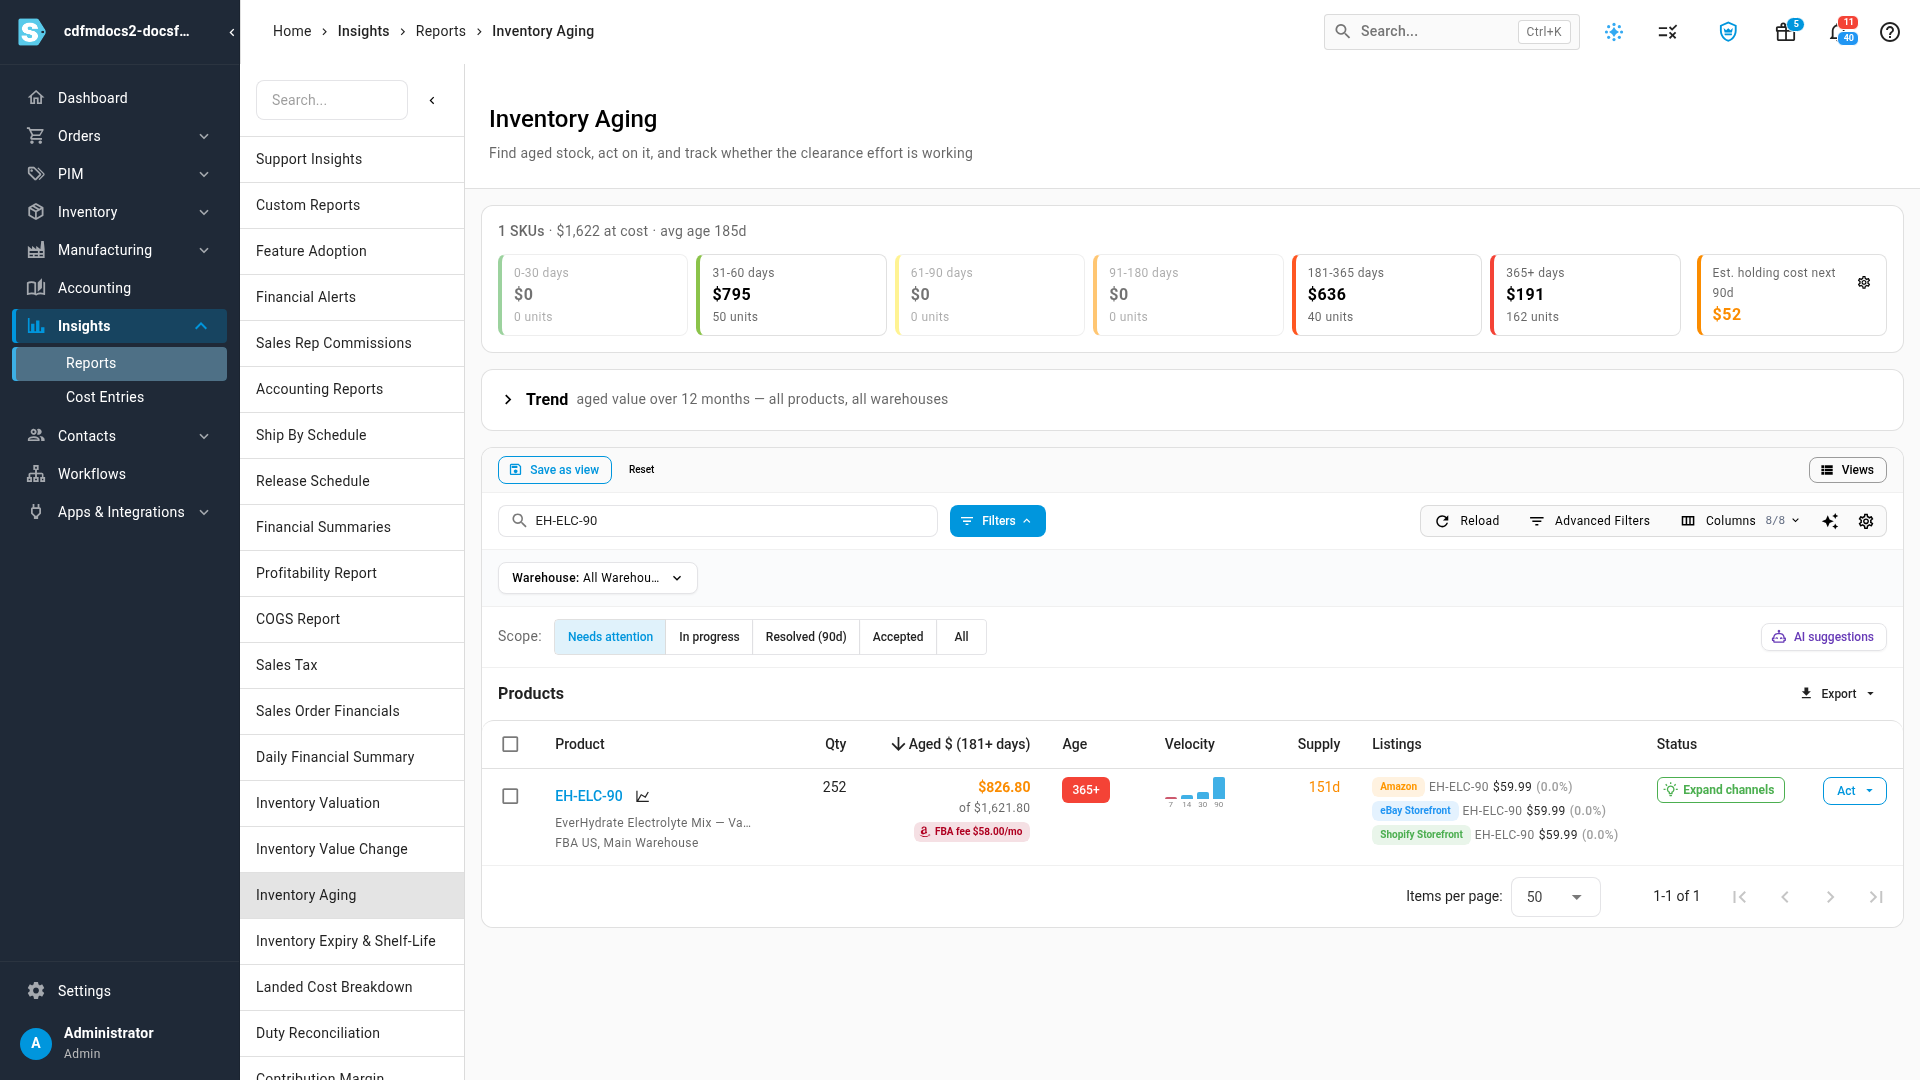
The chip is an estimate from the age of your FBA stock. For what Amazon actually charged, see Check the FBA aged inventory surcharge.
Open a product's details
Click anywhere in a row (other than a link or button) to open the product's details.
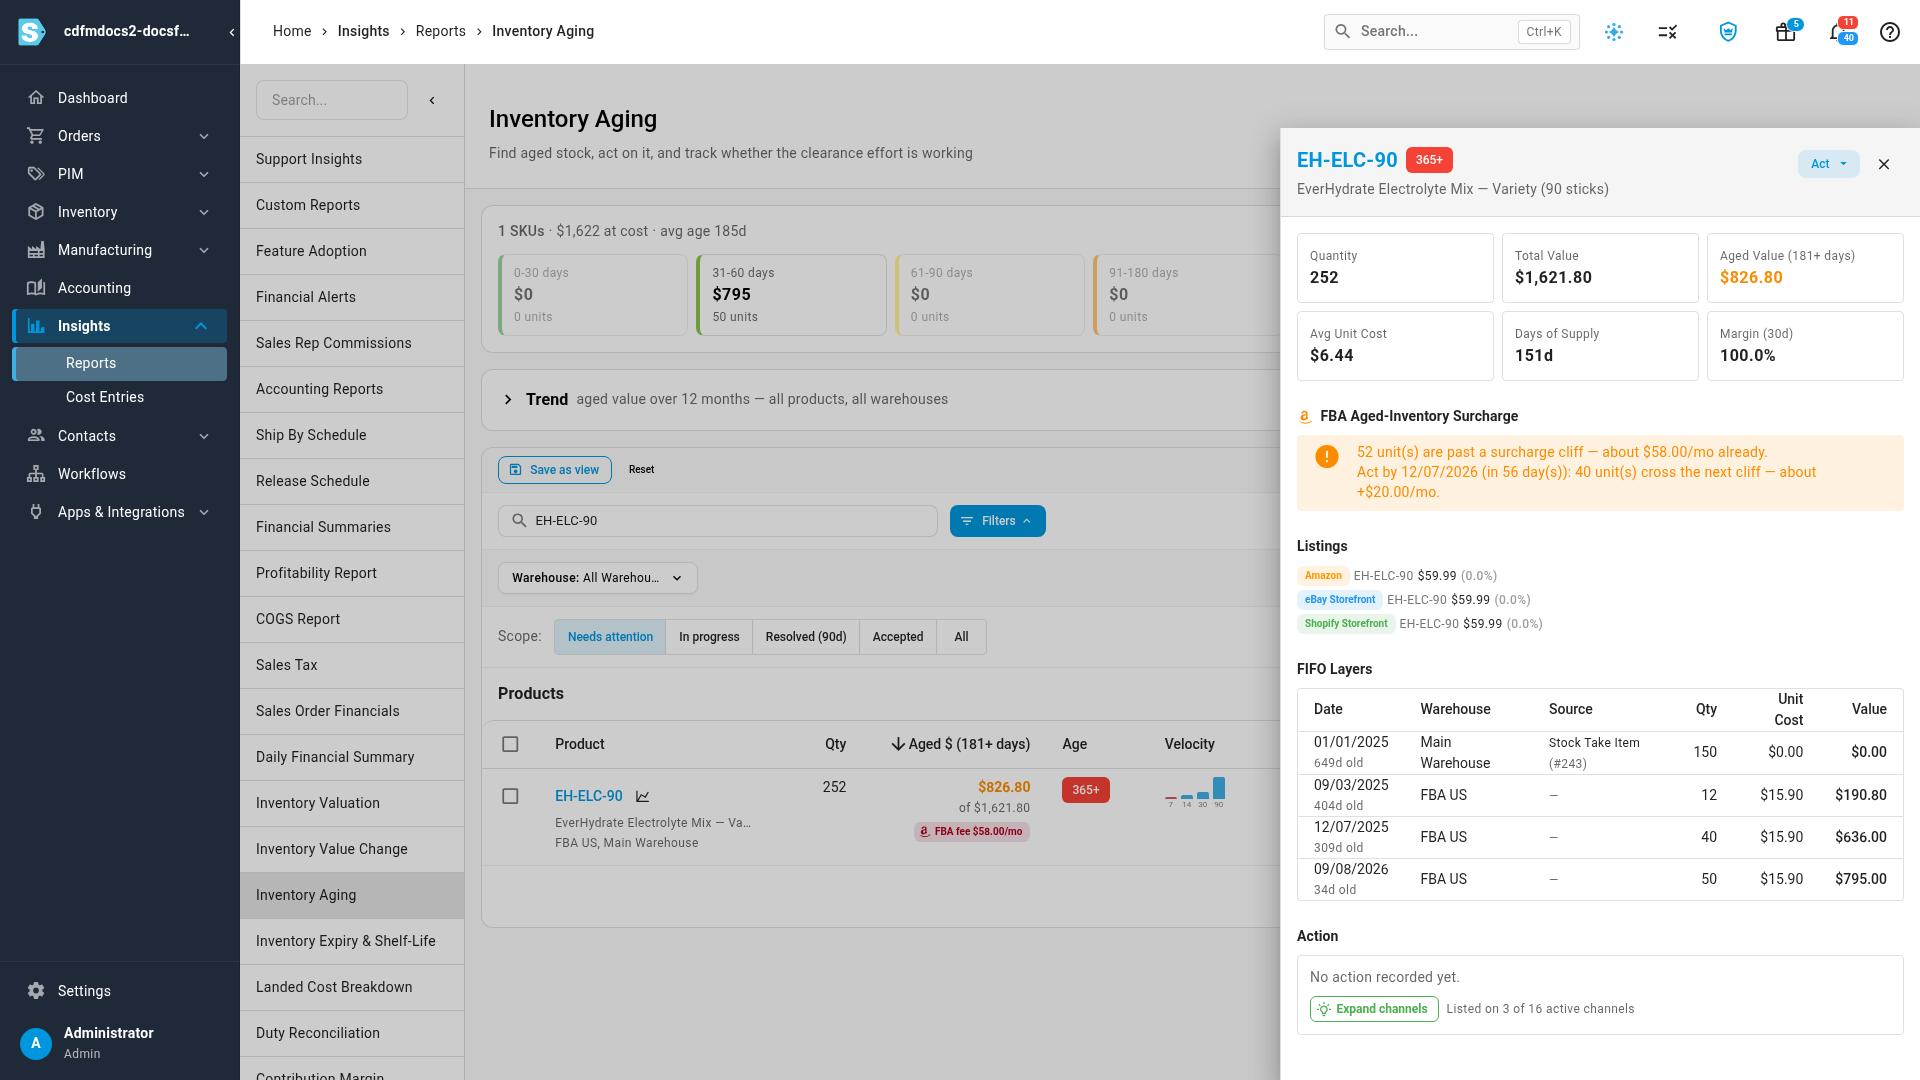
The panel shows the product's quantity, total and aged value, average unit cost, days of supply and 30-day margin. For stock at Amazon, FBA Aged-Inventory Surcharge says how many units are already past a tier and when the next units cross one, with the extra monthly cost: that date is when to act. FIFO Layers lists every batch of stock with its date, age, warehouse, source, quantity and value. Listings and Action sit alongside.
Record what you did
When you act on an aged product, record it so the team knows it's being handled.
- In the product's row, click Act.
- Choose Record action….
- Under Action type, pick what you did: Price reduced, Listed on channel, Promotion, Bundled, Transferred, Removal ordered, Written down or Other. It starts on the suggested step.
- Optionally, under Assign to, choose the teammate who owns it.
- Optionally, add a Note.
- Click Save.
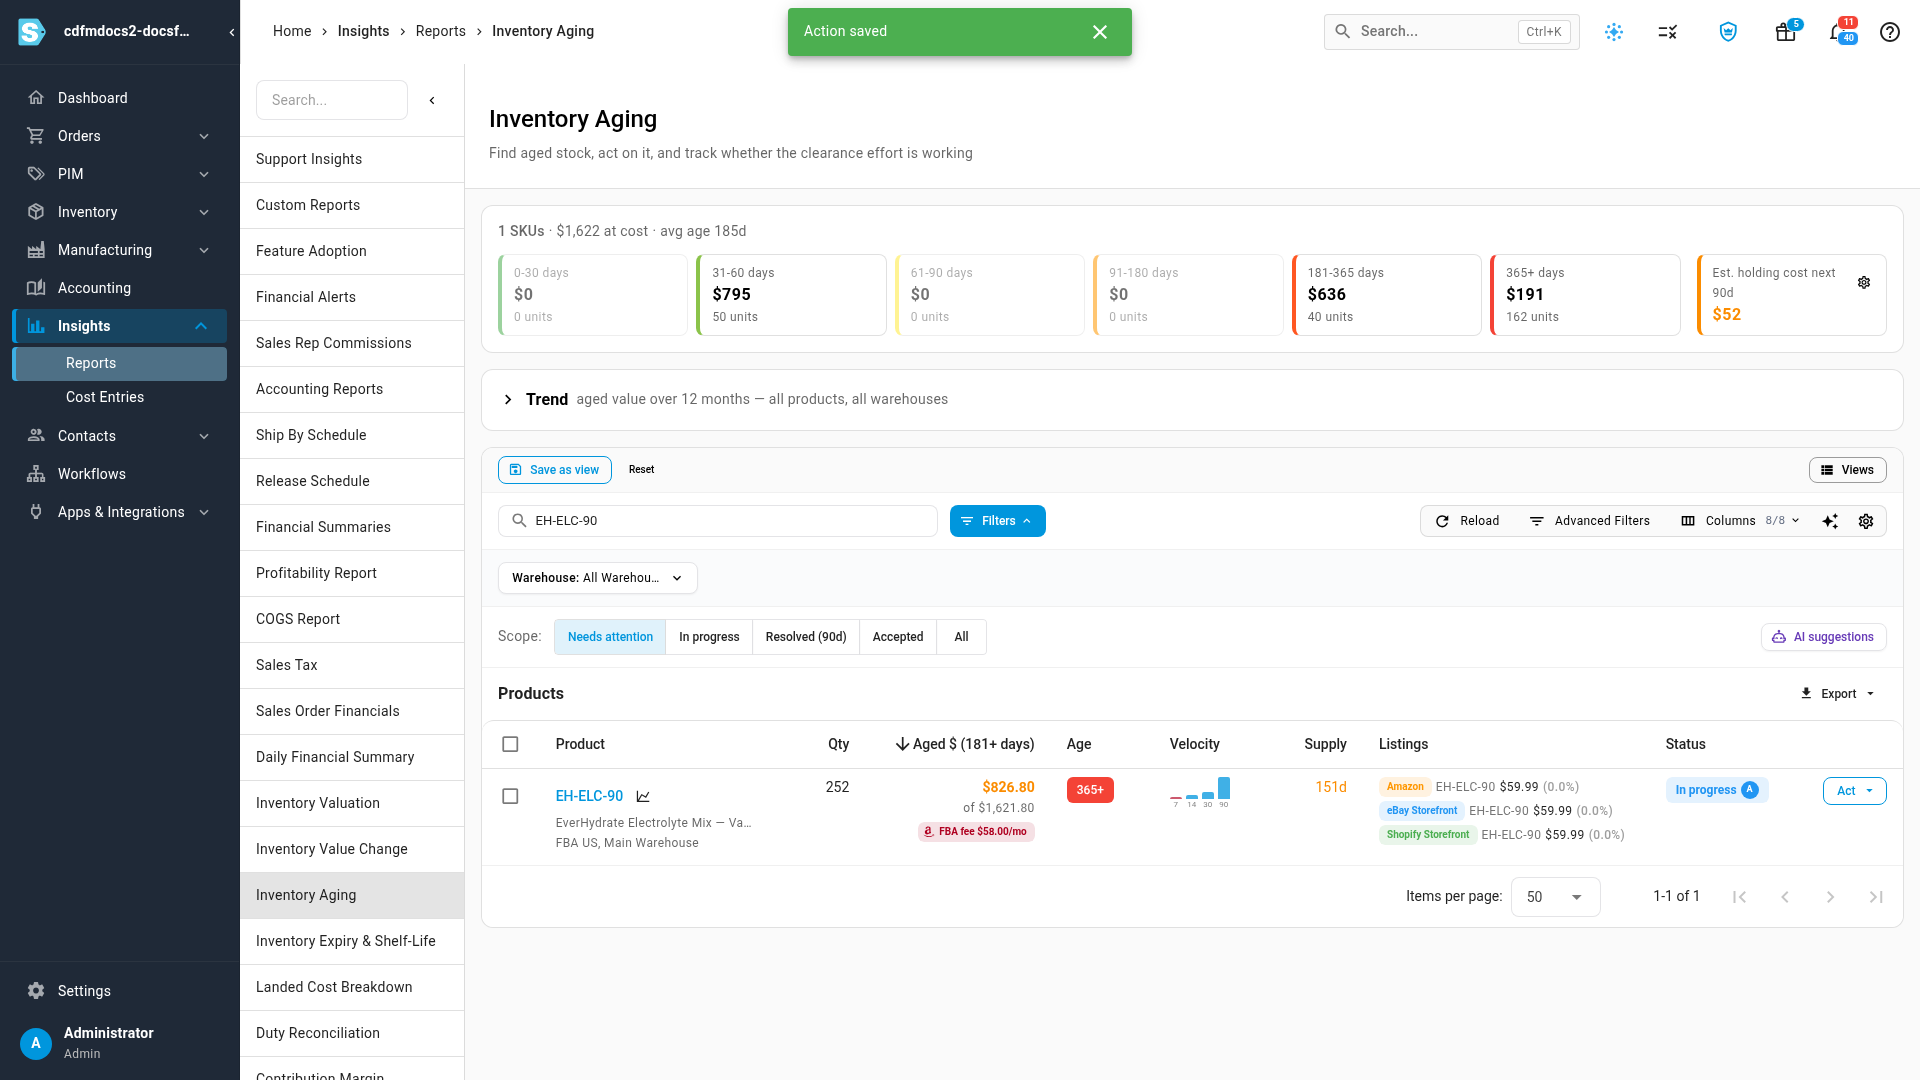
The product's Status changes to In progress. Clicking a suggested step in the Status column opens the same dialog.
To act on several products at once, tick their checkboxes and use Act in the bar that appears. Bulk actions work on up to 50 products at a time.
Fix it at the source
The Act menu also opens the screen where you fix the problem:
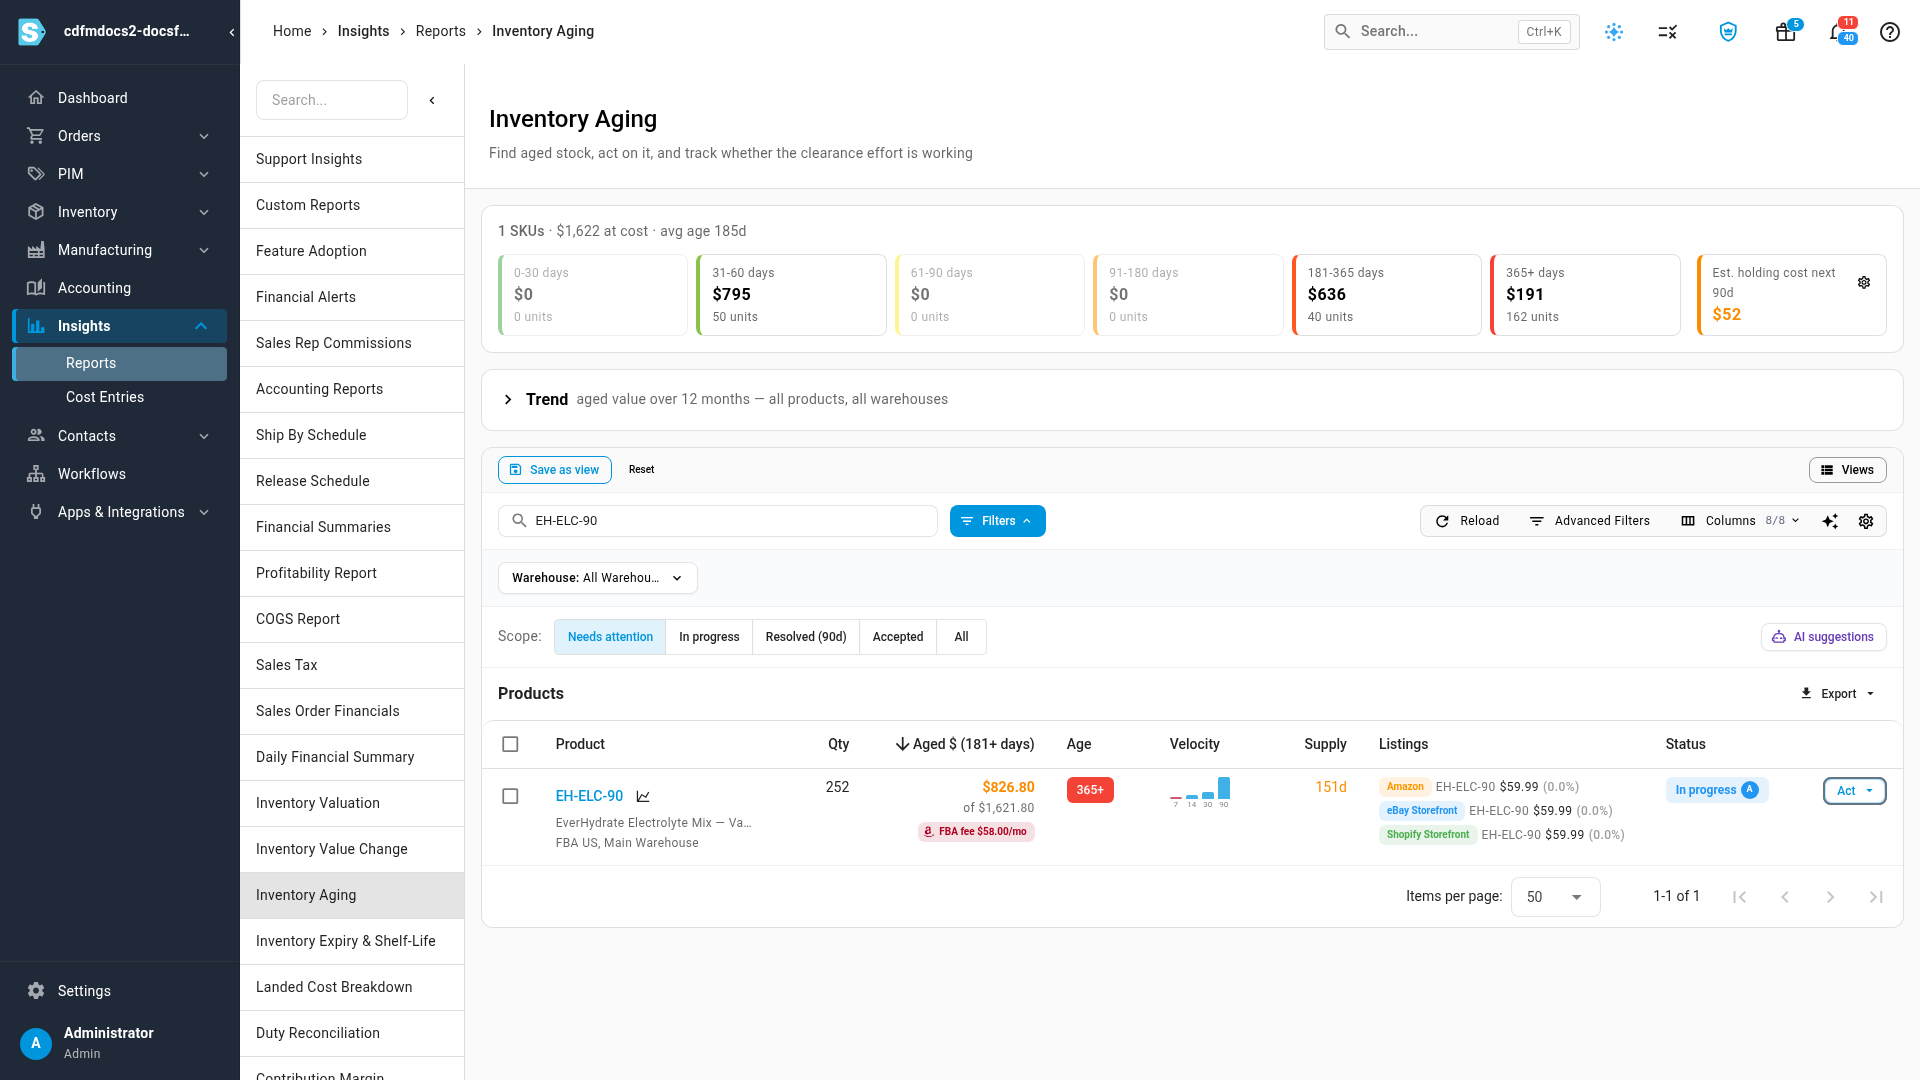
| Option | Opens |
|---|---|
| Adjust price | The product's pricing, to lower its price. |
| Create listing | The product's listings, to list it on another channel. |
| Transfer stock | A new warehouse transfer, to move the stock where it sells. |
| Open FBA removal orders | Your FBA removal orders. Only shown for products with stock at Amazon. You place the removal in Seller Central; SKU.io imports it so you can receive it. See Receive FBA removal orders back into stock. |
| Mark resolved… | Closes the product out. Choose Sold through, Cleared or Written off, and add a note. |
| Accept as evergreen… | Marks stock you mean to keep, so it stops being flagged. Optionally set Snooze until: on that date the product comes back to Needs attention. |
| Reopen | Moves a product you resolved or accepted back to Needs attention. |
Work through the queue
Use Scope above the list to see one part of the work at a time:
| Scope | Shows |
|---|---|
| Needs attention | Aged products nobody has closed out yet. Products In progress stay here until you resolve or accept them, and so do accepted products whose snooze date has passed. |
| In progress | Products with a recorded action. |
| Resolved (90d) | Products marked resolved in the last 90 days. |
| Accepted | Products accepted as evergreen. |
| All | Every product with stock. |
The age buckets and the trend always cover all products, whatever scope you pick.
Get the weekly digest
Every Monday morning, admins get a Weekly Aged Inventory Digest in their alerts. It totals your stock aged 181 days and older, counts the products still needing action, names the products most at risk, and says how much value crossed into the 181-365 day bucket that week. It links straight back to this report, and it's skipped in a week with nothing aged.
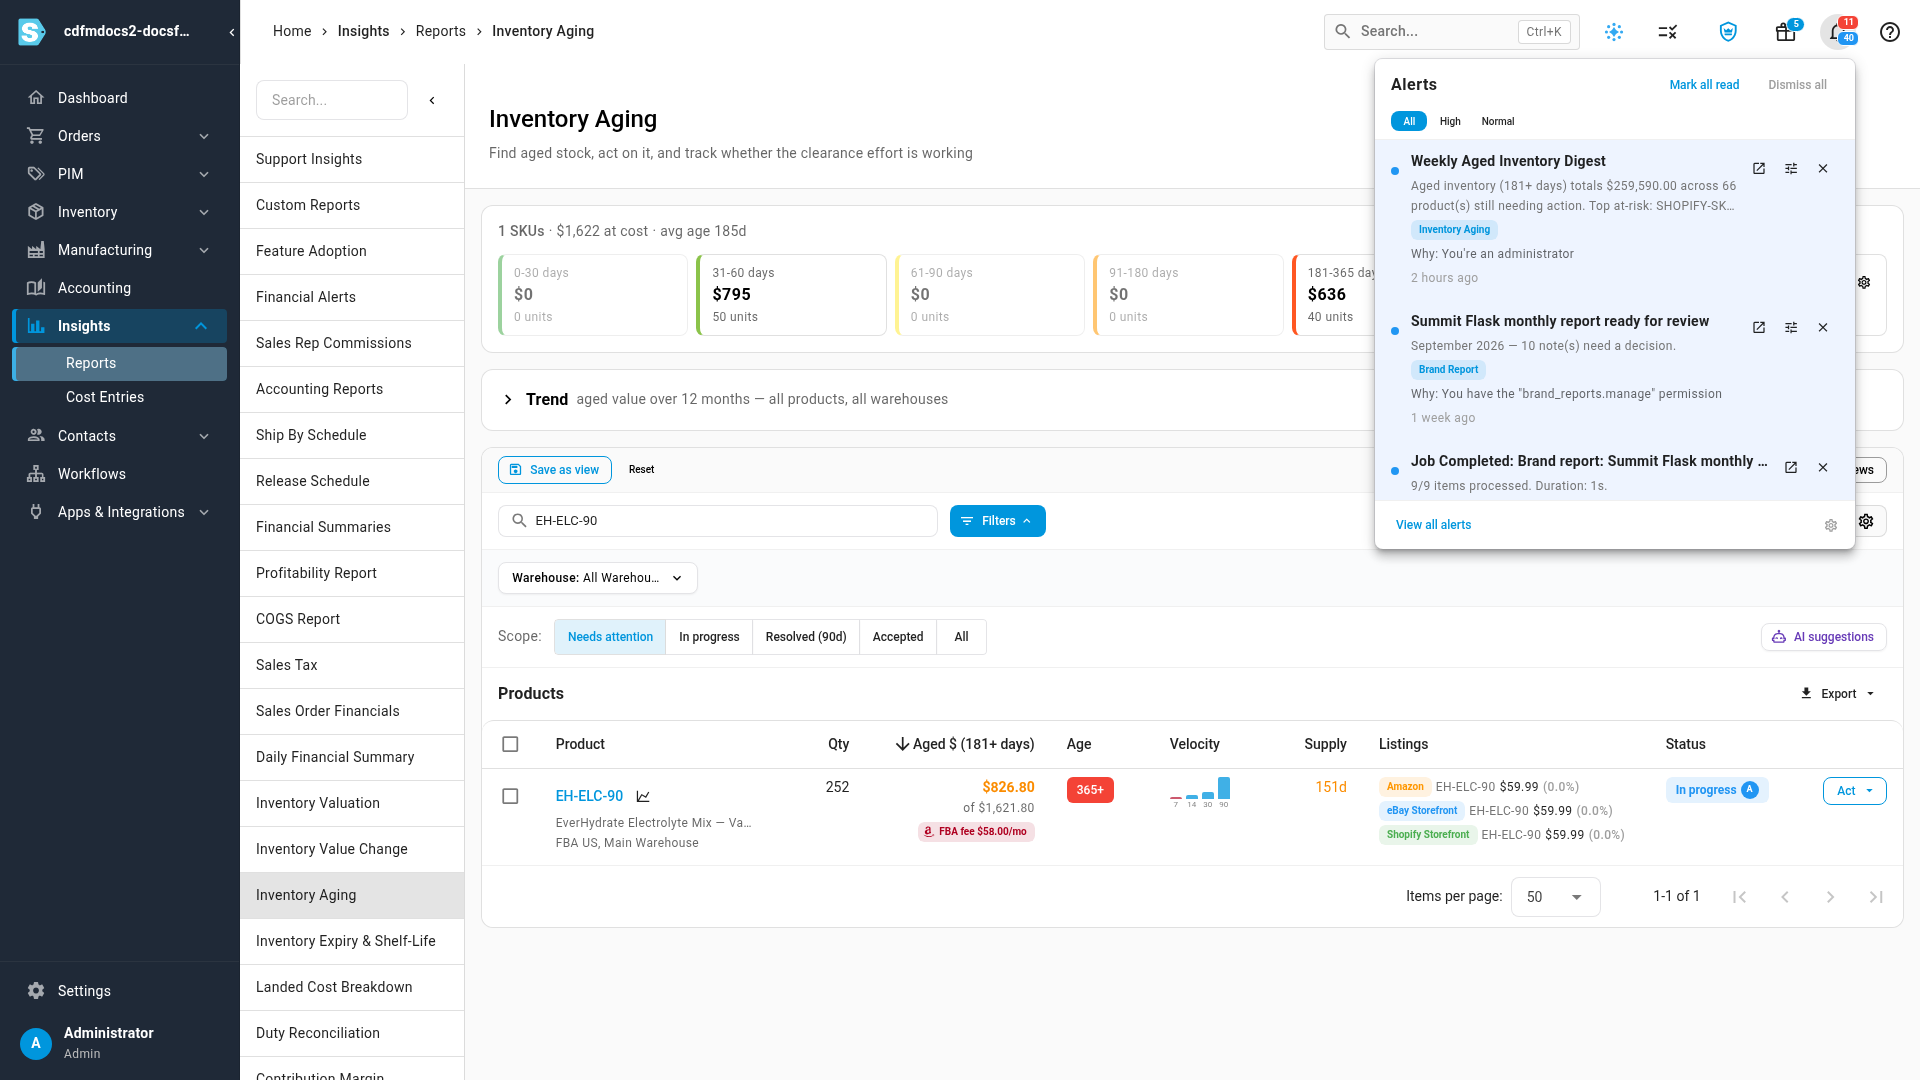
To choose who gets it, or to turn it off, see Choose which alerts your team gets.
Export the report
Click Export above the product list and choose a file. Both are CSV files.
Product summary CSV has one row per product: every product in the list as you're viewing it (search, filters, bucket and scope), not just the current page.
| Column | Notes |
|---|---|
| Product ID, SKU, Product Name, Brand, Supplier | The product. |
| Warehouses | Every warehouse holding it, comma-separated. |
| Quantity, Avg Unit Cost, Total Value | Stock on hand at cost. |
| Aged Value, Aged Value Window | The aged value and the age it measures, such as 181+ days. |
| Holding Cost (90d) | The estimated 90-day holding cost. |
| FBA Aged Units, FBA Monthly Surcharge, FBA Next Cliff Date, FBA Next Cliff (+$/mo) | The FBA surcharge estimate. Blank for products with no stock at Amazon. |
| Default Retail Price | The product's default price. |
| Age Bracket, Max Days Old | The bucket and age of the oldest stock. |
| Sold 7d, Sold 14d, Sold 30d, Sold 90d | Units sold. |
| Days of Supply | Infinite when it hasn't sold. |
| Channel Sales 30d (Units), Channel Sales 30d (Revenue), Channel Sales Breakdown | Sales by channel over 30 days. |
| Avg Selling Price 30d, Margin % 30d, Total Revenue 30d, Total COGS 30d | 30-day profitability. |
| Listing Count, Listings | Each listing as channel, SKU and price. |
| Suggested Action | The suggested next step. |
| Action Status | Needs attention, In progress, Resolved or Accepted. |
| Action Type, Assigned To, Note | The recorded action. |
FIFO detail CSV has one row per batch of stock, for every product. It follows the Warehouse filter and the bucket you clicked, but not the search or other filters: ID, SKU, Product Name, Supplier, Brand, Warehouse, Age Bracket, Days Old, FIFO Layer Date, Link Type and Link ID (the record that brought the stock in), Quantity, Unit Cost and Total Value.
Next steps
- Check the FBA aged inventory surcharge: see what Amazon actually charged, by product, tier and month.
- Value your inventory: see what all your stock is worth today.
- Attribute storage fees and ad spend to products: turn Amazon's surcharge into cost entries on the products that caused it.
Video transcript
To find stock that has been sitting too long, open Insights in the sidebar, and then choose Reports. Scroll down the list of reports until you reach Inventory Aging, then open the report. The report opens on every warehouse, with the stock that needs attention first. It shows how long your stock has been on hand, valued at what you paid. The strip across the top splits your stock value into age buckets. Each card shows what that stock cost you, and its number of units. The last card estimates the price of holding your aged stock for another ninety days. Click a card, such as 365+ days, to narrow the list to stock of that age. The aged value column now counts only that bucket. Click the same card a second time, and the list goes back to all of your stock. Once there's enough history, the Trend chart opens on its own. It shows your aged value over 12 months, stacked by age bucket. A shrinking red band means your clearance work is paying off. Click Trend to fold the chart away, and bring the product list up. You can unfold it again at any time. Each product gets a row, with the most aged value first. Velocity charts the units sold over the last seven to ninety days. Supply estimates how long your stock lasts at that pace. Status suggests a next step, such as listing the product on more channels. Type a product's name or code into the search box to find it quickly. Stock held at Amazon shows an FBA fee chip, under its aged value. The chip estimates the monthly aged-inventory surcharge on that stock. Click the row to see the product's details. The surcharge panel tells you when more units cross into the next surcharge tier. FIFO Layers lists each batch of stock, with its warehouse, age and value. When you act on aged stock, record it here, so your team knows it's being handled. Close the details panel first. Then click Act on the product's row, and choose Record action. Under Action type, pick the kind of action you took, such as a promotion. Under Assign to, choose the teammate who owns the follow-up. Add a note, so everyone knows exactly what changed. Click Save, and the product's status changes to In progress. Use Scope to switch between what needs attention, what's in progress, and what's closed. Products in progress stay under Needs attention until they're resolved or accepted. The Act menu also takes you to where you fix the problem. Adjust price, Create listing, Transfer stock, and FBA removal orders each lead to the screen where you make the change. Mark resolved closes the product out. Accept as evergreen stops flagging stock you mean to keep. Every week, admins also get a Weekly Aged Inventory Digest in their alerts. It totals your stock older than six months, names the products most at risk, and links straight back to this report.