Read the COGS report
The COGS Report answers "what did the goods I sold cost me?" for any period. It reads your inventory movements and Amazon's FBA ledger directly, so it works whether or not you use SKU.io's accounting. Group it by sales channel, country, brand or SKU, and drill into the movements behind any figure.
Before you begin
- You need access to the COGS Report under Report Access in your role.
- Costs come from your FIFO layers. A movement with no cost counts as $0.00, so fix missing costs first if you can.
There are two. This one is built from inventory movements and needs no accounting set-up. The Accounting COGS report, under Accounting → Reports, is built from posted ledger entries and ties to your books. When accounting is on, a banner at the top of this report links to it. The two can differ where the ledger has posted a cost true-up, or where entries haven't posted yet.
Run the report
-
Go to Insights → Reports and open COGS Report.
-
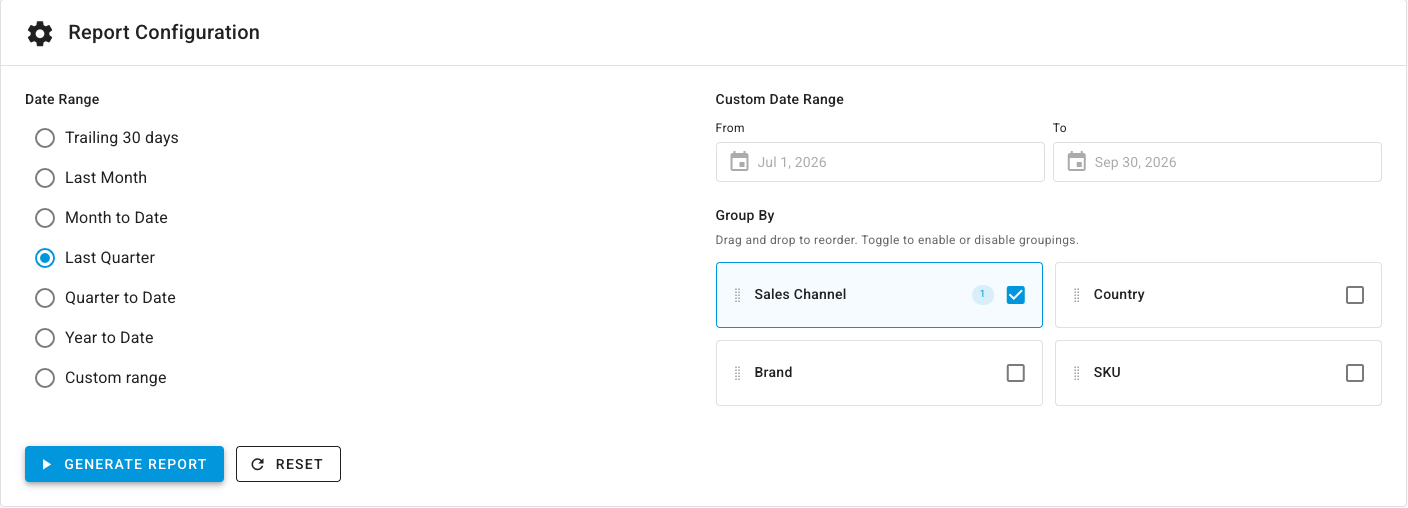
Under Date Range, pick a period, such as Last Month or Quarter to Date. For any other dates, choose Custom range and set From and To.
-
Under Group By, tick the groupings you want: Sales Channel (on by default), Country, Brand or SKU. Drag them to set the nesting order, for example sales channel, then SKU. At least one must be ticked.
-
Click Generate Report. Reset puts the settings back to their defaults.
Read the results
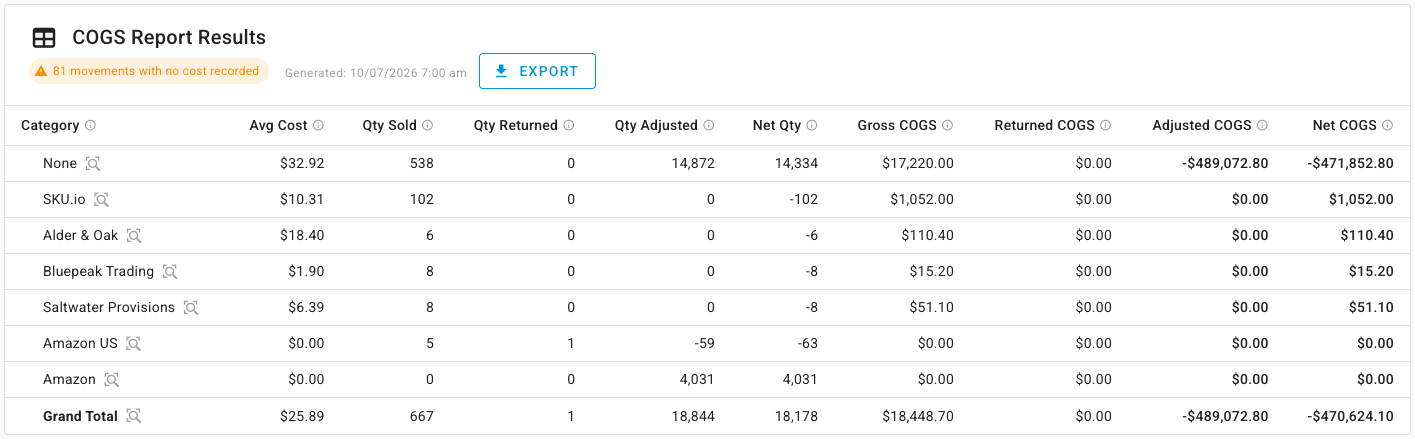
Each row is one group, and nested groups expand and collapse under their parent. Movements that don't belong to a sales channel, such as stock takes and adjustments, are grouped under None. A Grand Total row closes the table.
| Column | What it shows |
|---|---|
| Qty Sold / Gross COGS | Units shipped to customers, from your warehouses and from FBA, and what they cost. This is your cost of goods sold. |
| Qty Returned / Returned COGS | Units customers sent back, and their cost coming back into stock. |
| Qty Adjusted / Adjusted COGS | Adjustments, stock takes and Amazon's adjustments, receipts, removals and transfers between fulfillment centers. Signed: it can go either way. |
| Net Qty / Net COGS | Gross COGS less Returned COGS, plus Adjusted COGS. |
| Avg Cost | Net COGS divided by Net Qty. |
Net COGS folds in adjustments, so a month with heavy Amazon receipts or stock-take gains can show a low, or even negative, Net COGS while you sold plenty. Your cost of goods sold is Gross COGS.
If some movements have quantity but no recorded cost, a warning chip beside the results title reads, for example, 3 movements with no cost recorded. Those movements count as $0.00, so the report understates your cost until they're fixed.
Every group that moved units is listed, even when its costs come to $0.00. An Amazon channel whose FBA units carry no cost, for example, still shows its quantities. So every Grand Total column, quantities and dollars alike, adds up to the rows above it.
See the movements behind a figure
- Click the drill-down icon beside a row's name, or beside Grand Total for everything.
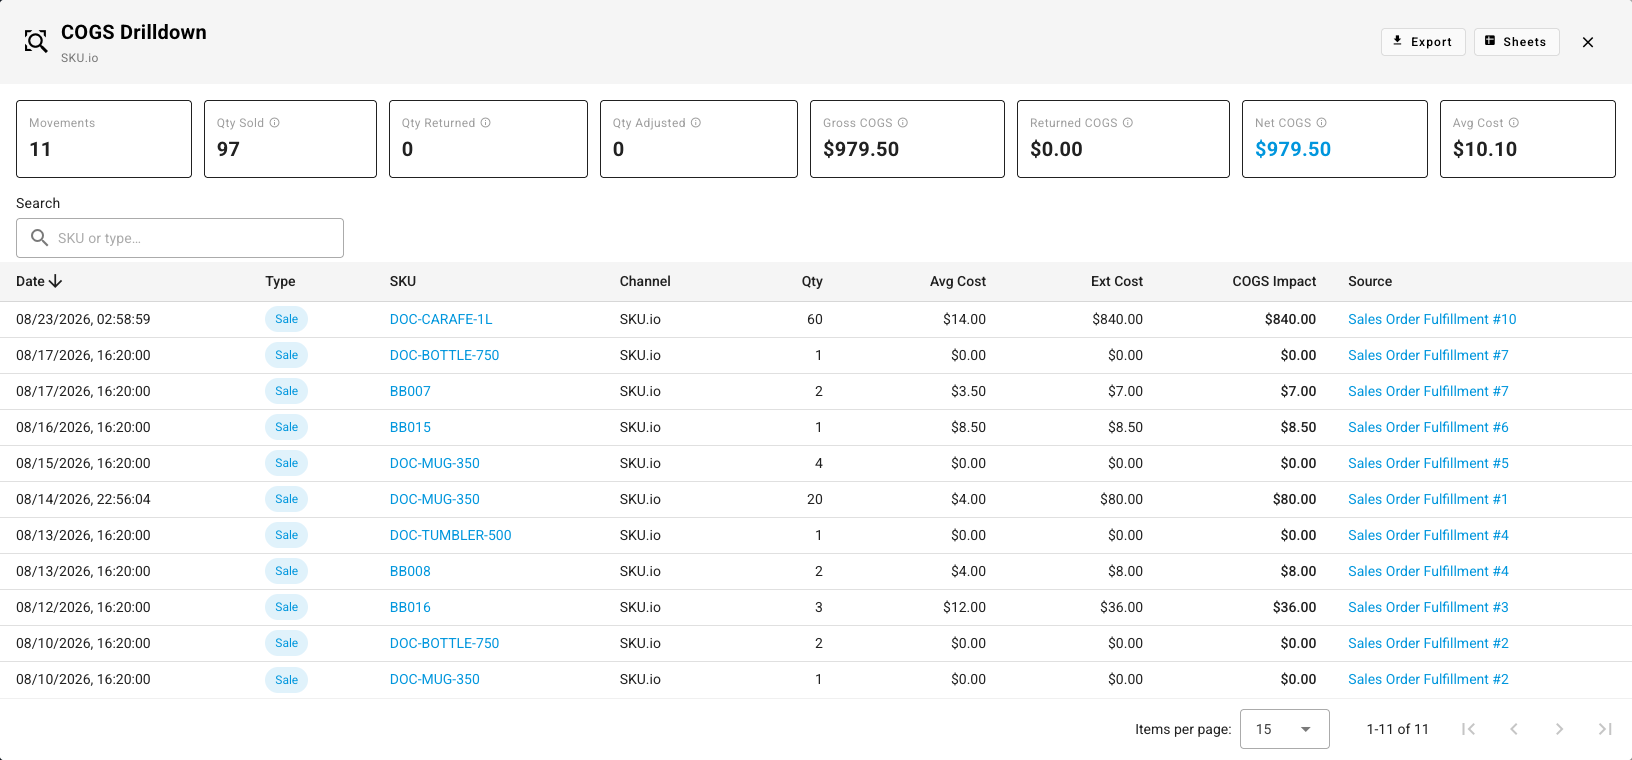
- The COGS Drilldown opens with the group's totals across the top (Movements, Qty Sold, Qty Returned, Qty Adjusted, Gross COGS, Returned COGS, Net COGS and Avg Cost) and every movement below: Date, Type, SKU, Channel, Qty, Avg Cost, Ext Cost, COGS Impact and Source.
- Search by SKU or type to narrow the list. A movement with $0.00 cost is one of the movements with no cost recorded.
- Click a SKU to open the product, or a Source, such as a sales order fulfillment, to open the document behind the movement.
- Click Export to download the movements, or Sheets to open them in a Google Sheet.
Export the report
Click Export above the results to download the grouped report as a spreadsheet.
Next steps
- Explain a change in inventory value — the full bridge from one month-end's stock value to the next.
- Reconcile your inventory value month over month — tie the figures to your ledger.
- FIFO layers and COGS — where each cost comes from.