Explain a change in inventory value
Your stock was worth one figure at the end of last month and another at the end of this one. The Inventory Value Change report explains the difference. It starts from the opening value, adds and subtracts each kind of activity in the period, and lands on the closing value, so you can see exactly what moved it and open the transactions behind each step.
Before you begin
- You need access to Inventory Value Change under Report Access in your role.
- The opening and closing values are the same figures the Inventory Valuation report shows for those days.
Run the report
-
Go to Insights → Reports and open Inventory Value Change.

-
Set Period start and Period end, or click a quick range: Last month, Last 3 months or YTD. The opening value is taken at the end of the day before the period starts, and the closing value at the end of Period end. The captions under the dates confirm both.
-
To narrow it, pick Warehouses, Brands or Suppliers (default). The supplier filter matches products by their default supplier.
-
Click Generate Report.
Read the bridge
The report opens on the Total lens: everything you own, on hand and in transit between your warehouses. The top row shows the Opening and Closing values with their units, the Net change between them, and how much of each is on hand and in transit. A chip confirms Statement ties to the cent: the categories below add up exactly to the change.
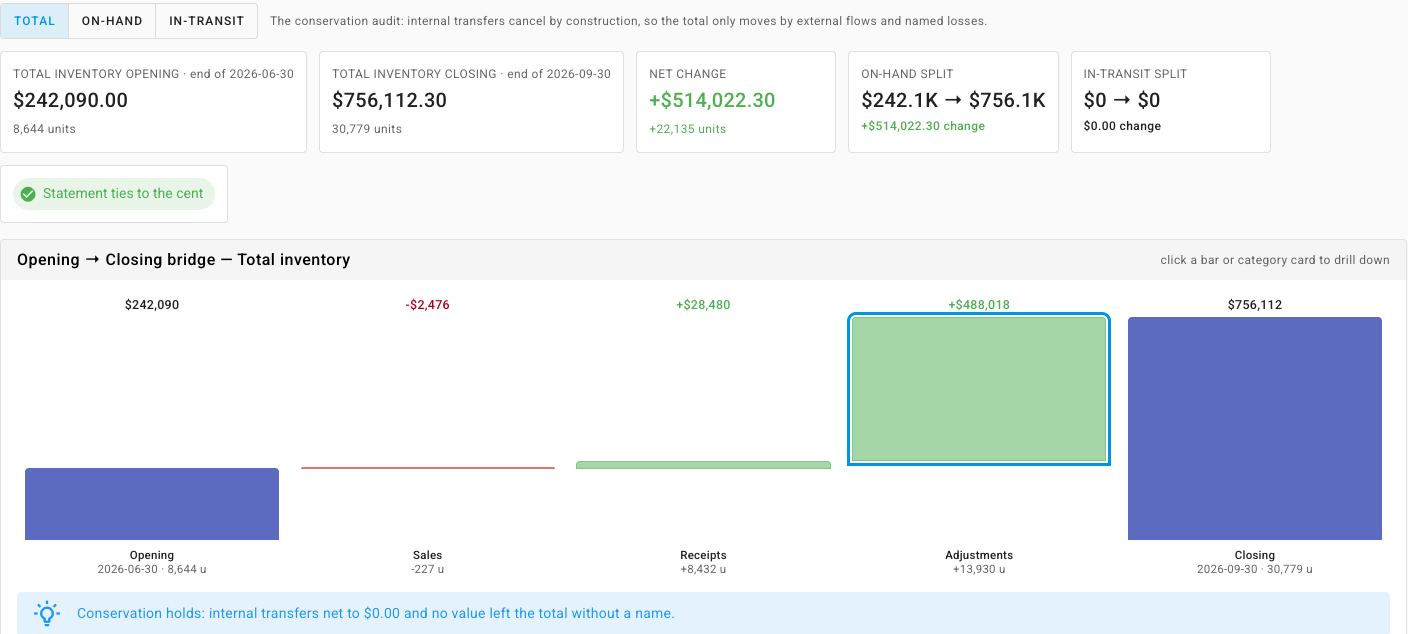
The Opening → Closing bridge chart walks from one to the other, one bar per category that moved. Under it, a card per category shows its value, units and number of transactions:
| Category | What's in it |
|---|---|
| Sales | Stock shipped to customers from your warehouses, FBA and AWD. |
| Receipts | Purchase order receipts, and Amazon inbound receipts. |
| Adjustments | Inventory adjustments, stock takes, Amazon's found, lost and damaged units, and any rounding when a cost layer closes. |
| Returns | Customer returns, returns to suppliers, and FBA removals. |
| Manufacturing | Assemblies, and manufacturing consumption, scrap and output. |
| Revaluations | Cost changes applied to stock you already held, such as a late supplier invoice or landed cost. |
| Internal transfers (net) | Stock moved between your own warehouses. On the Total lens it should net to $0.00, and the card reads nets out. |
| Landed costs (capitalized into transit) | Freight and duty added to stock while it was between warehouses. |
| Transit losses | Value that left transit without arriving, such as a declared shortage or a write-off. |
A memo can appear under the chart, naming how much of the period's figures came from cost revisions rather than trade. It's already included in the categories; it isn't an extra amount.
Drill into a category
Click a bar or a category card. The drill-down opens below it, starting with the largest category. On the left it lists each kind of activity in the category with its total, such as Inventory adjustments and Stock takes. Click one to list its transactions on the right: Date, SKU, Warehouse, Type / Event, Qty, Unit Cost, Value and Source. Amazon rows also show the FNSKU and disposition, and revaluation rows show the old and new cost.
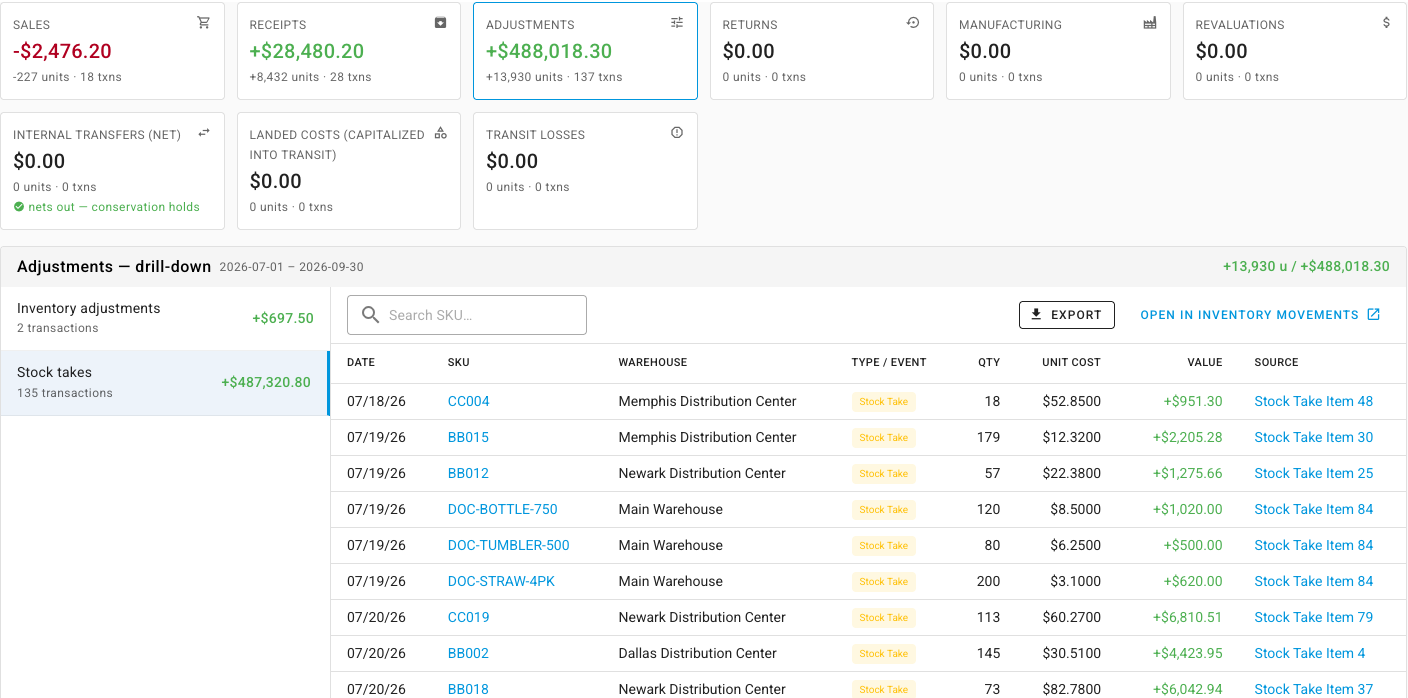
- Click a SKU or a Source to open the product or the document.
- Search SKU narrows the list.
- Export downloads the transactions.
- Open in Inventory Movements shows the same movements on the inventory movements list.
Switch lens: total, on-hand or in-transit
Above the tiles, three buttons change what's being explained:
- Total — on-hand and in transit together. Moves between your own warehouses cancel out here, so the total only changes with sales, receipts, returns, adjustments and named losses. Open Internal transfers (net) to see each pairing of the on-hand and in-transit sides.
- On-hand — why the stock in your warehouses changed: sales, receipts, transfers, adjustments. Here transfers show as their own Transfers category. An In transit tile shows stock that was between warehouses at each end, for context.
- In-transit — what happened to stock between warehouses: dispatches into transit, freight and duty added to it, arrivals out of it, and transit losses.
Total and In-transit need every warehouse, so they're unavailable while a warehouse filter is on. Brand and supplier filters keep every lens.
When something doesn't add up
- A residual warning appears when more than $1 of the change isn't explained by the categories. The report treats it as a sign of a data problem worth investigating, not rounding, so don't dismiss it. Contact support with the dates and filters you used.
- Statement does not tie — report this means the categories don't add up to the change. Contact support with the dates and filters you used.
- Fractional units can appear on Amazon rows, because Amazon's inbound shortages are spread across a shipment's lines. The values are exact.
Export it
Click Export, beside Generate Report, to download the statement for the period and filters you ran.
Next steps
- Reconcile your inventory value month over month — tie the same change to your ledger accounts.
- Read the COGS report — cost of goods sold by channel, brand or SKU.
- Value your inventory — the value on a single day.