Read the Landed Cost Breakdown report
The Landed Cost Breakdown report shows what the goods you sold really cost, per unit and in total, split into cost categories: the product itself, plus freight, customs duty, insurance, brokerage, handling and any other landed cost you've billed against your stock. Group it by sales channel, brand, product, supplier or warehouse to see where the extra costs land.
Before you begin
- Your role needs access to the Landed Cost Breakdown report under Report Access.
- The report reads the cost each sale took from its stock. Landed costs appear once they're billed against the goods: see Add landed costs to a purchase order and Record landed cost bills.
- The categories come from your cost categories. See Manage cost categories.
Generate the report
-
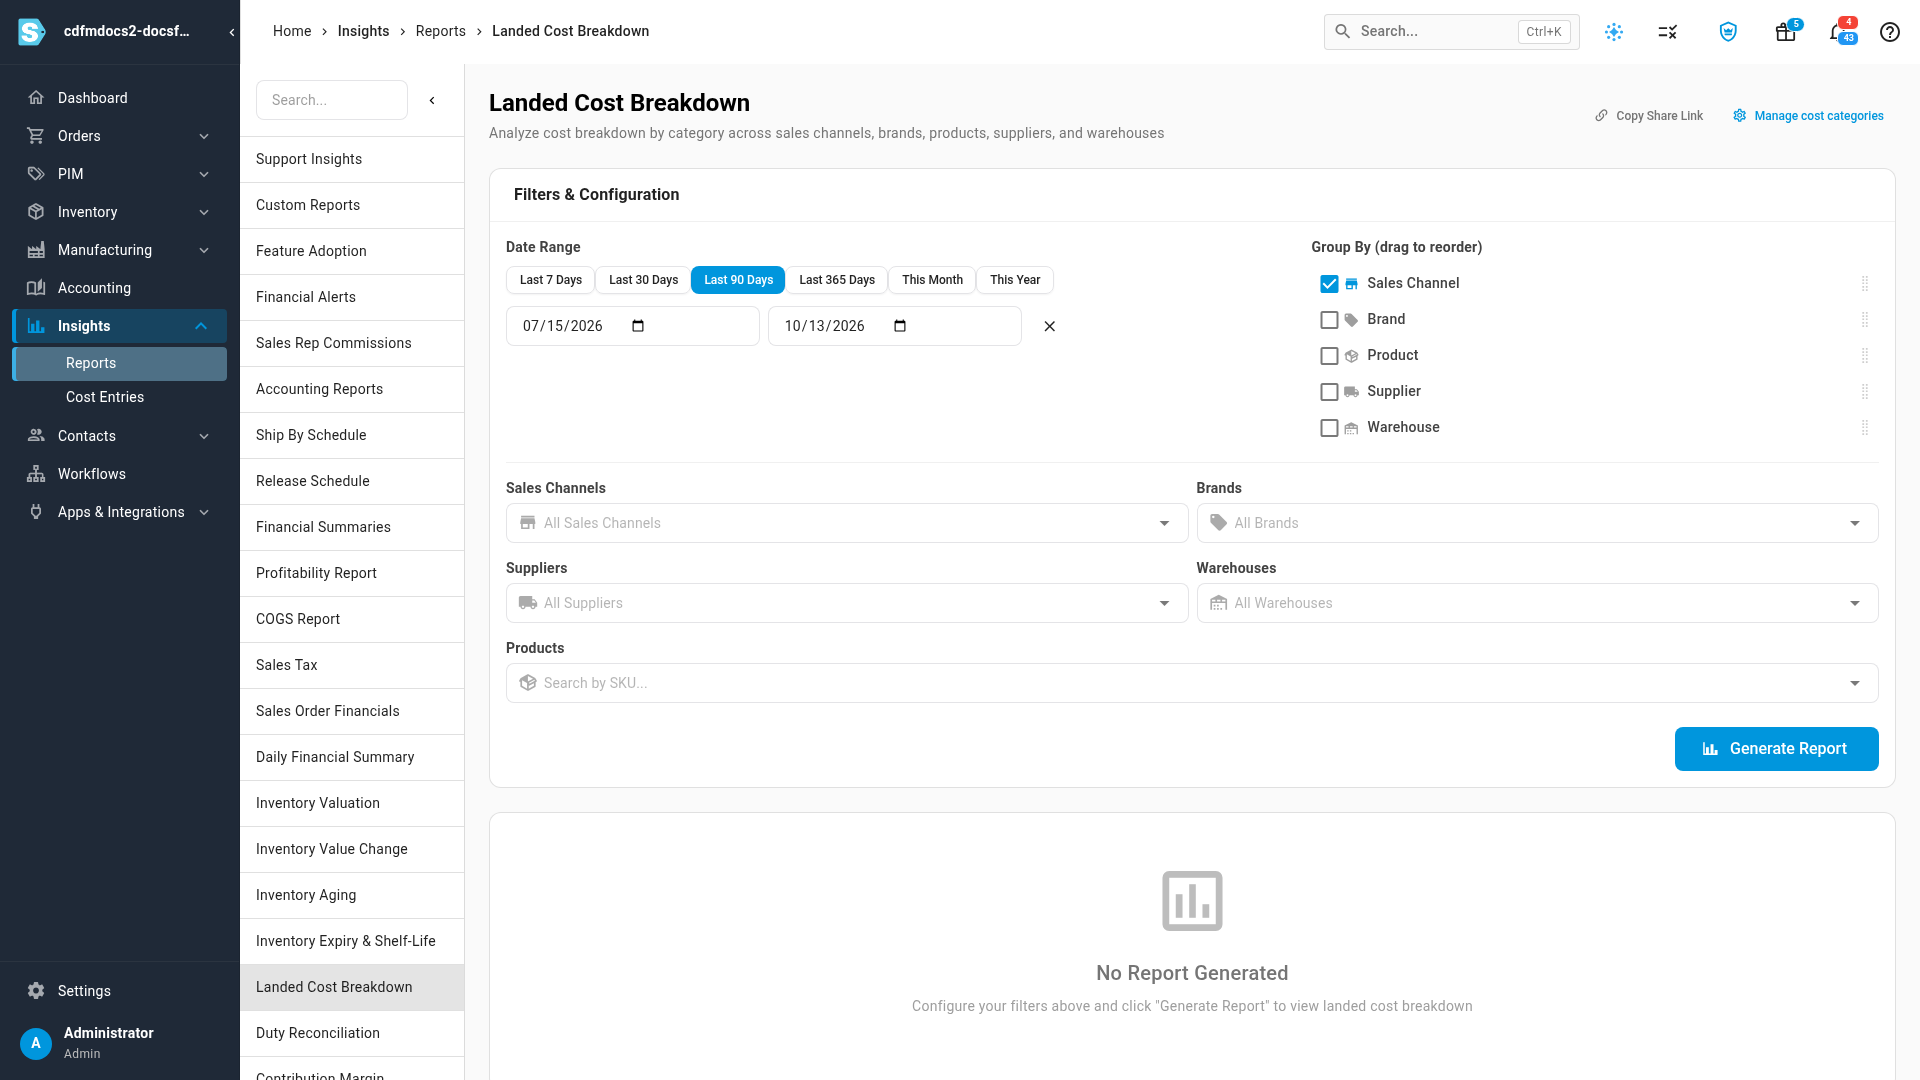
Go to Insights → Reports and choose Landed Cost Breakdown.
-
Under Date Range, pick a preset — Last 7 Days, Last 30 Days, Last 90 Days, Last 365 Days, This Month or This Year — or set your own start and end dates. Sales are counted by their order date; draft and canceled orders are left out.
-
Under Group By, tick how to split the results: Sales Channel (ticked to start with), Brand, Product, Supplier or Warehouse. Tick more than one to nest them, and drag them into the order you want. At least one must be ticked.
-
Optionally, narrow the report under Sales Channels, Brands, Suppliers, Warehouses and Products.
-
Click Generate Report.
The report is built in the background, and the job tray shows its progress. When it's ready, the filters fold away into a summary line; click Filters & Configuration to open them again.
Read the cost per unit
Per-Unit Landed Costs shows the average cost of each unit sold in the period.
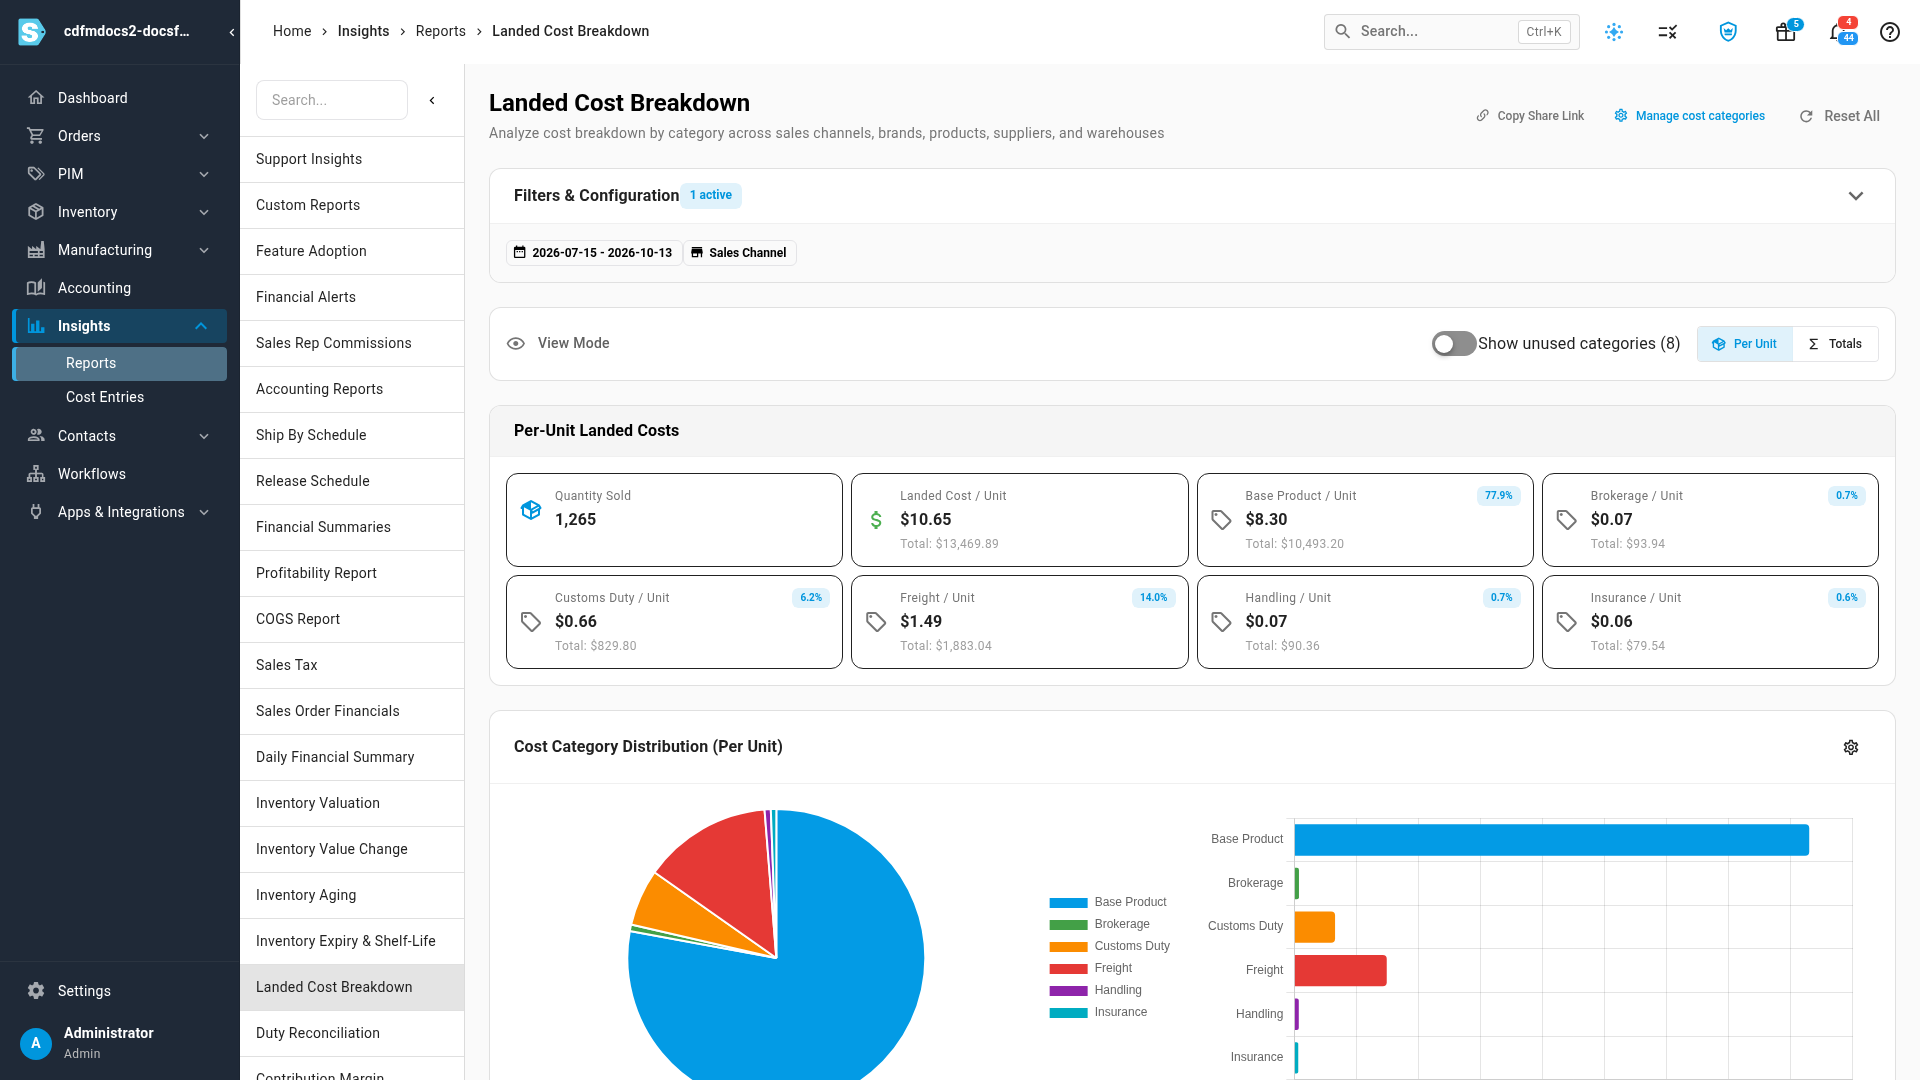
- Quantity Sold is the number of units sold.
- Landed Cost / Unit is the full cost of each unit, with the period's total underneath.
- Each other card is one cost category: its cost per unit, its share of the landed cost, and its total. Base Product is what you paid the supplier for the goods.
Categories that carry no cost in the period are hidden, so the cards and the table only show the costs you actually have. Turn on Show unused categories, beside Per Unit and Totals, to see every category.
Under View Mode, choose Totals to see the dollars in each category instead of the cost per unit. Cost Category Distribution charts the same split as a pie chart and a bar chart; its gear opens your cost categories.
Compare groups
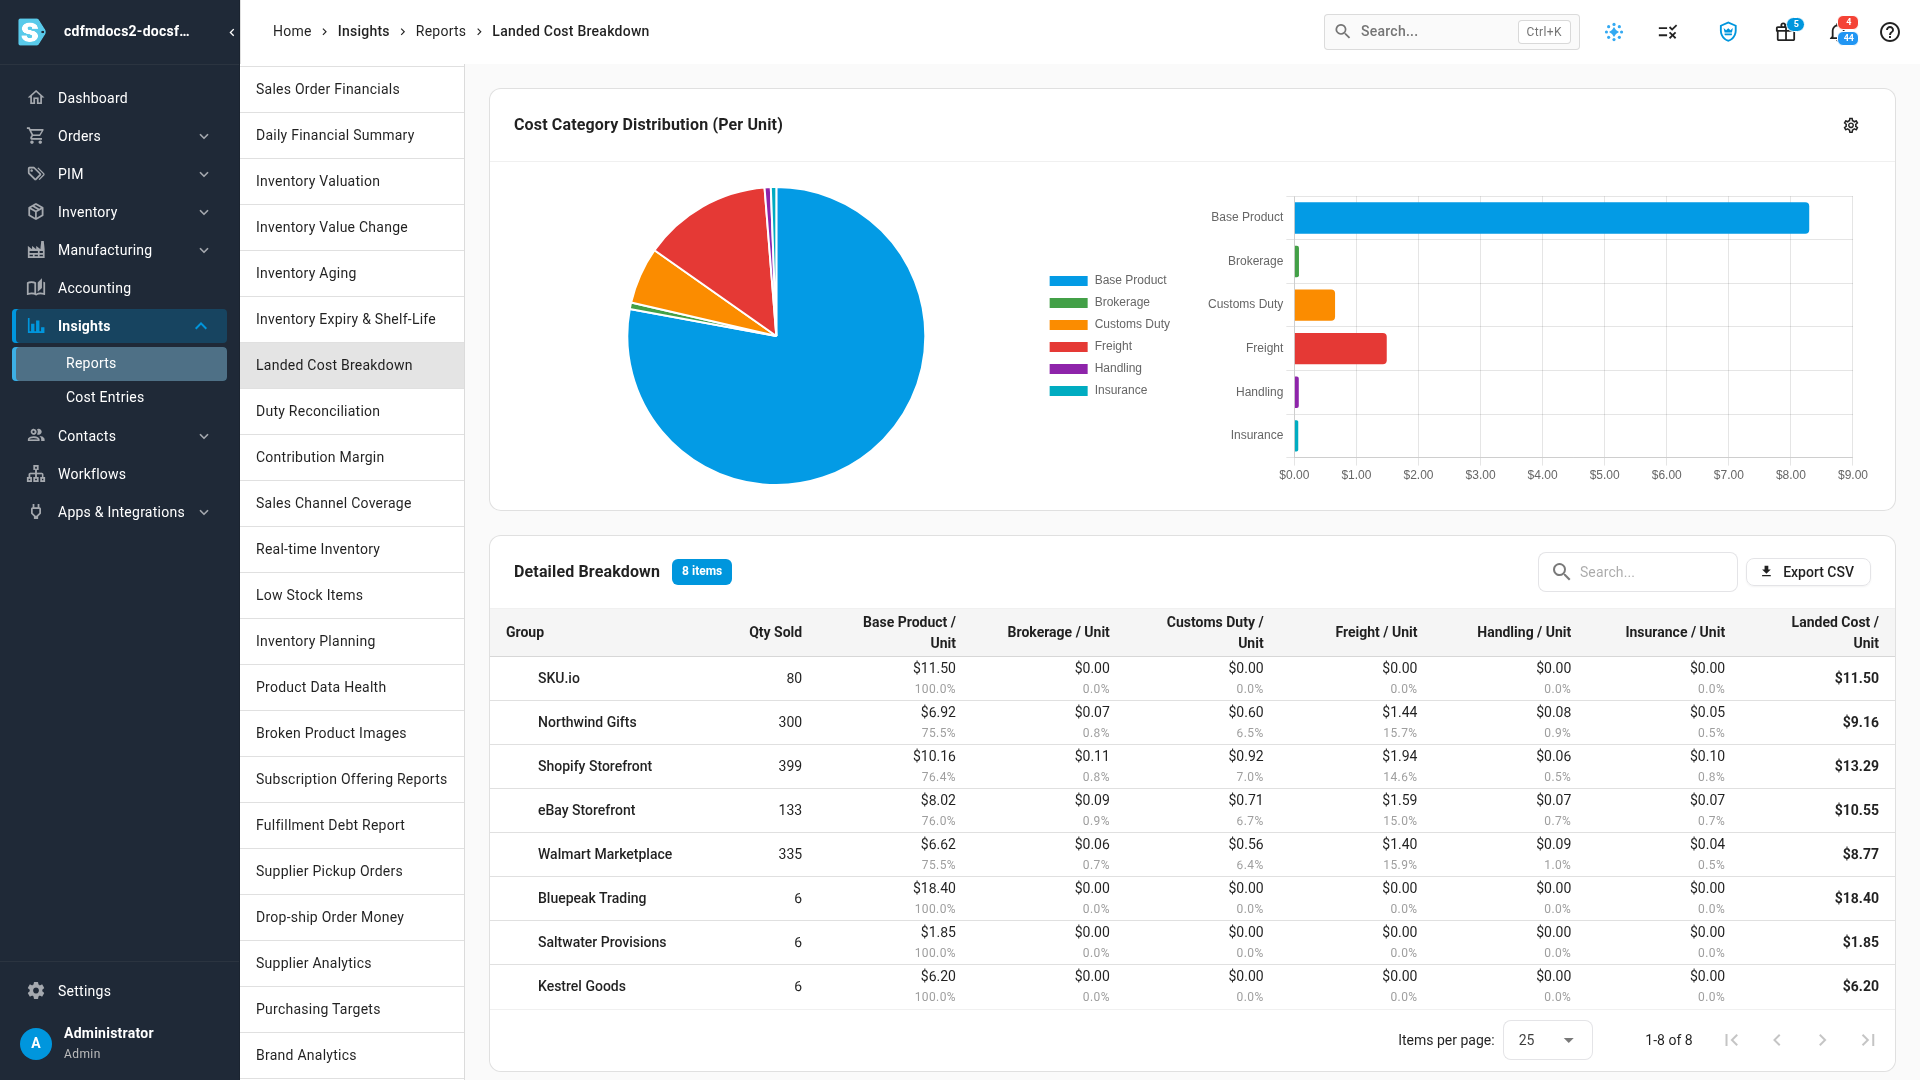
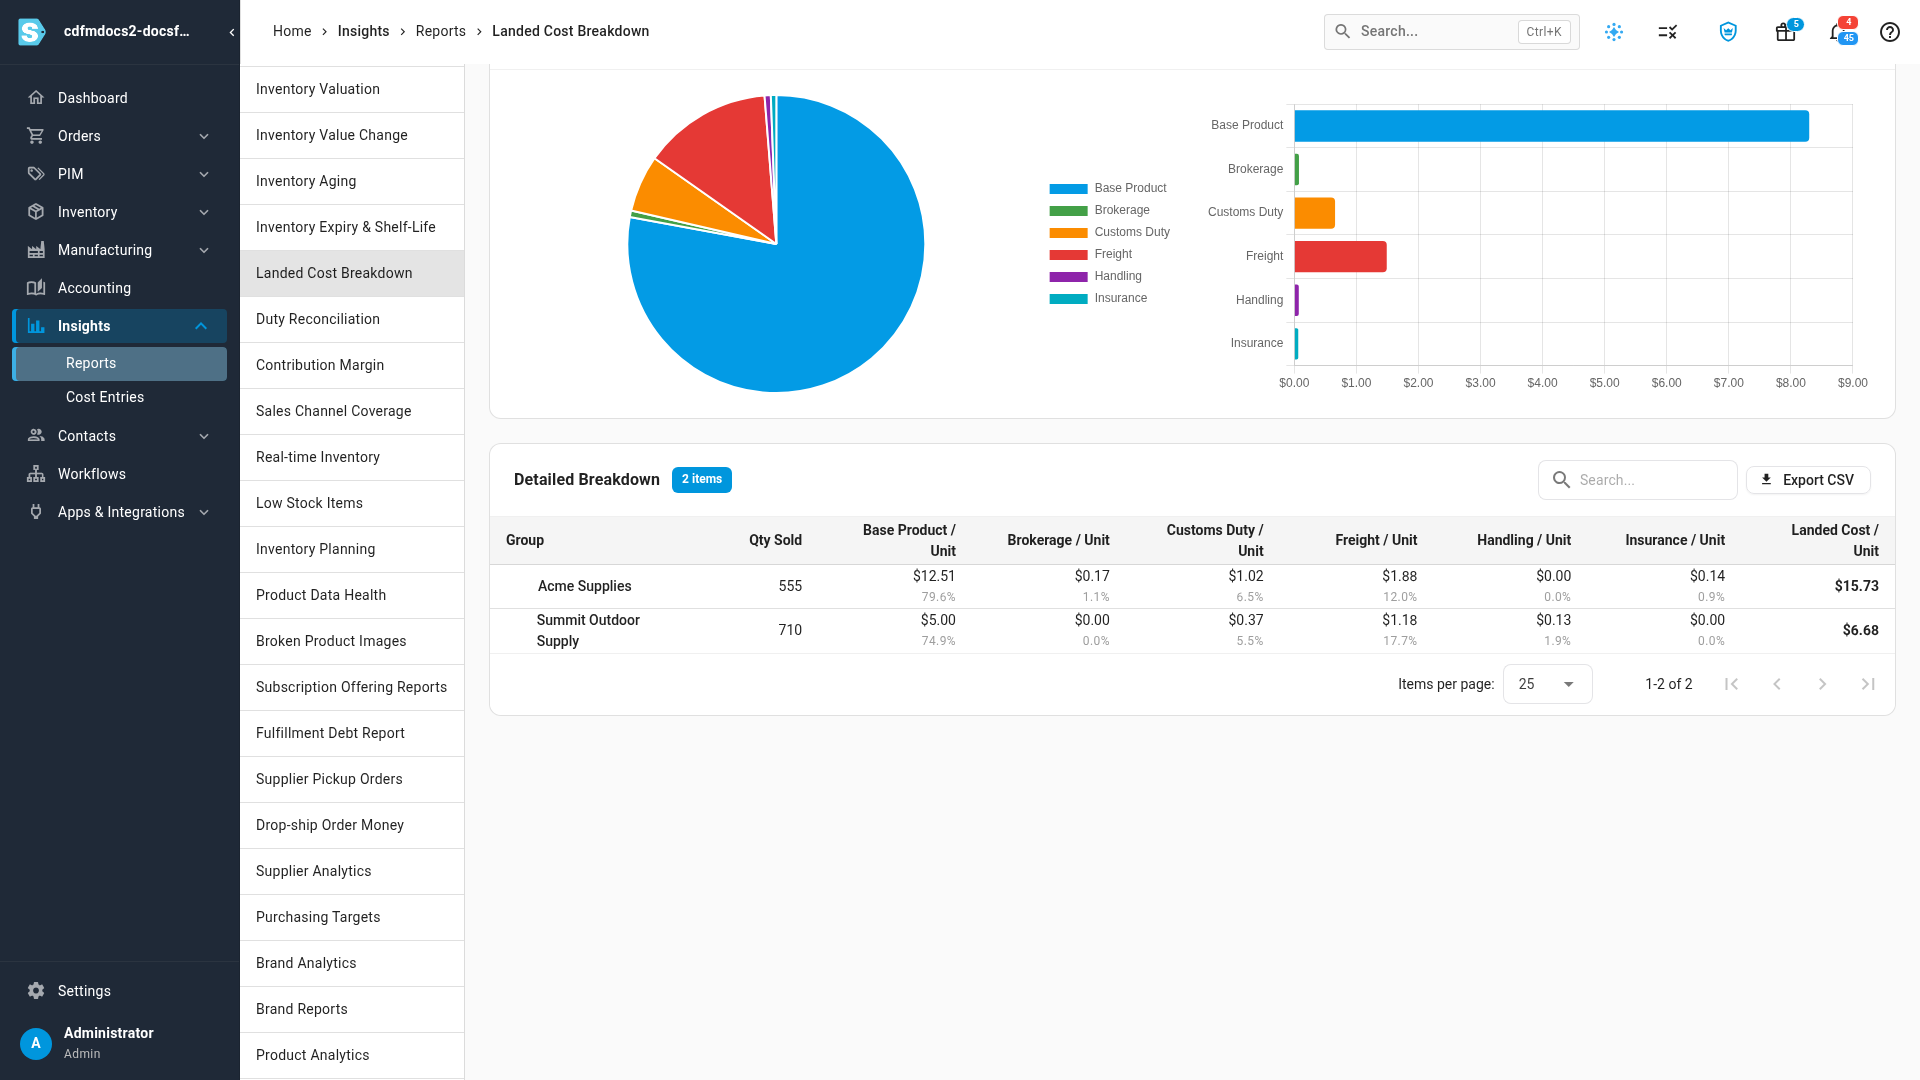
Detailed Breakdown has one row per group, such as each sales channel, with Qty Sold, each category's cost per unit (or total) and its share, and Landed Cost / Unit (or Total Landed Cost) in the last column.
What each grouping uses:
| Group By | Groups sales by |
|---|---|
| Sales Channel | The channel the sales order came from. |
| Brand | The product's brand. |
| Product | The product sold. |
| Supplier | The supplier on the purchase order the stock was received from. Sales of stock that didn't come from a purchase order aren't listed. |
| Warehouse | The warehouse the stock was sold from. |
With more than one grouping, expand a row to see the next level, or use the expand-all button above the table. Search the table to find a group.
Export and share
- Export CSV downloads the breakdown as a CSV file. It has a column for each grouping you chose (such as Sales Channel), Quantity Sold, one column per cost category with that category's total for the group, and Total Landed Cost. Every cost category gets a column, including unused ones.
- Copy Share Link copies a link to the report with your current period, grouping and filters, so a teammate opens the same view.
- Reset All puts every filter back to its default.
Next steps
- Read the COGS report: total cost of goods sold by channel, country, brand or SKU.
- Add landed costs after receipt: bill freight or duty that arrives after the goods.
- Analyze profitability: see margin after these costs.
Video transcript
To see what the goods you sold really cost, open Insights in the sidebar, and then choose Reports. Scroll down the list of reports until you reach Landed Cost Breakdown, and click it to see the report settings. The report opens on its filters and configuration, ready for you to choose what to show. Pick a period, such as the last ninety days. The report counts sales by their order date. Under Group By, choose how to split the results. Sales Channel is ticked to start with. The filters below narrow the report down even further. Click Generate Report when the settings look right. The report is built in the background, and the job tray shows its progress. The cards show the average cost of each unit you sold. Landed Cost per unit is the total, and each card below it is one cost category, with its share of that total. Here, freight adds about a dollar and a half to every unit, and customs duty adds another sixty cents or so. Categories with no cost are hidden. To see every category, turn on the switch beside Per Unit. Switch the view mode to Totals to see the dollars in each category, instead of the cost per unit. Then switch back to Per Unit, to return to the cost of each unit. Scroll down to the Detailed Breakdown. Each row is one sales channel, with the units it sold and the cost per unit in each category. The last column is the full landed cost per unit, so you can compare channels side by side. Export CSV downloads the same breakdown as totals. To compare suppliers instead, scroll back up and open Filters and Configuration. Under Group By, untick Sales Channel, and then tick Supplier instead. Then click Generate Report again. It takes a moment to build the new breakdown, grouped the new way. Now each row is a supplier, so you can compare whose goods carry the most freight and duty, from Acme Supplies to Summit Outdoor Supply.