Value your inventory
The Inventory Valuation report answers "what's your stock worth right now?" — an end-of-day snapshot of on-hand, in-transit, inbound, and prepaid inventory at cost, that you can group by warehouse, brand, or supplier and drill into by SKU.
Before you begin
- You need permission to view reports.
- Valuation uses your FIFO cost layers, so products should have received stock with costs.
Run the report
- Go to Insights → Reports and open Inventory Valuation.
- In Report Configuration, set the End of Day date — the report values your stock as of the close of that day.
- Under Group By, choose how to break the numbers down — Warehouse, SKU, Brand, Supplier, or COGS Nominal Code. Combine dimensions for a nested breakdown (for example, Warehouse then SKU).
- Click Generate Report.
Read the results
The results open with summary tiles for the whole selection:
- On-Hand Quantity / Value — units physically in your warehouses and their cost.
- In-Transit Quantity / Value — stock moving between warehouses, including Amazon return removals on their way back to you.
- Inbound Quantity / Value — stock on the way in from suppliers.
- Prepaid Quantity / Value — stock paid for but not yet received.
Below the tiles, a grouped table breaks the value down by your Group By choice, with columns for on-hand (available, allocated, on hold), average cost, and value, plus in-transit, inbound, prepaid, and any discrepancy. Use Search by SKU to jump to a product, and Collapse / Expand Columns to focus the view.
A removal order that has no receiving warehouse yet shows its in-transit units on an In Transit (no destination warehouse) row. Set the warehouse on the order to move them under it. See Receive FBA removal orders back into stock.
See values in a second currency
If your account has more than one currency, Also show amounts in appears next to Report Results. Values stay in your base currency, which is what your books hold. Pick another currency and every tile and amount gets a second line in it, such as $740,444.80 with ≈ 1,028,395.56 CAD under it, converted at the rate for your End of Day date. Pick your base currency to show one currency only.
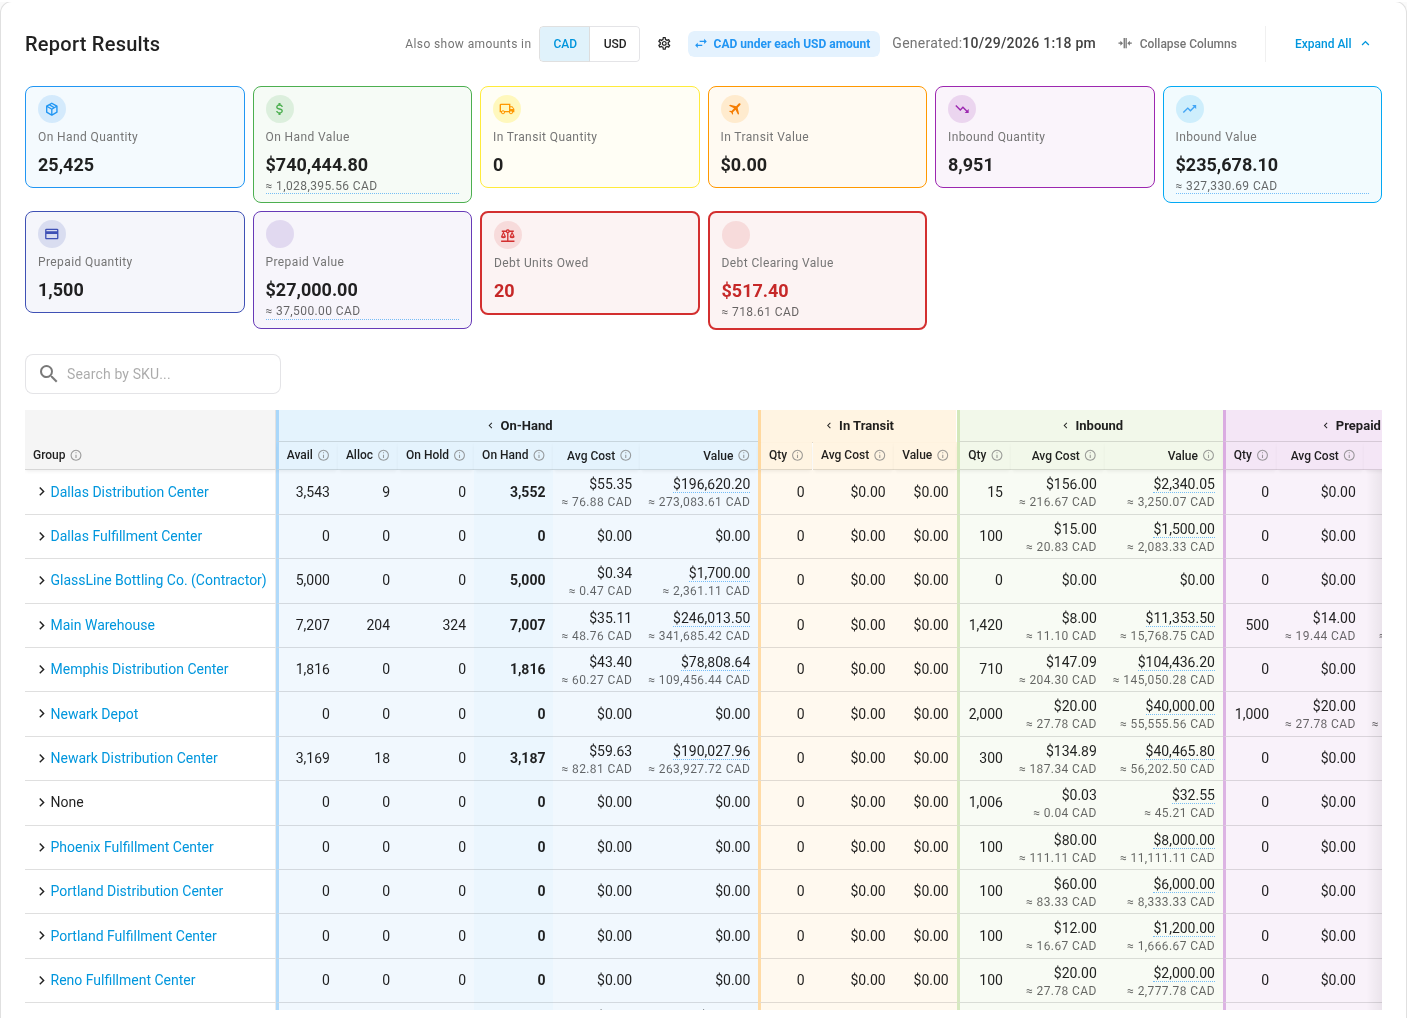
The report opens in your account's Default report currency. See Work in multiple currencies.
Export it
Click Export to download the report — useful for a period-end stock figure, an audit, or sharing with your accountant. The export is in your base currency only.
Next steps
- Reports catalog — other reports and what each answers.
- FIFO layers and COGS — how the cost behind each valuation is built.
- Run month-end operations reports — stock per warehouse alongside units sold, transfers, receipts and adjustments.
Video transcript
The Inventory Valuation report tells you what your stock is worth. Open it under Insights, set the end-of-day date, and choose how to group — by warehouse, brand, or SKU — then generate. The summary values your whole selection at cost: on-hand stock, plus what's in transit, inbound from suppliers, and prepaid. The table breaks it down group by group, drillable to the SKU. Search for a product, or export the whole report for your period-end figure.