Segment sales with Financial Summaries
Financial Summaries answers "how did each brand, supplier, SKU, or channel do, period by period?" for one metric at a time. Each row is one group, each column is one period, and a total runs along both. Use it for a quick ranking or trend, such as revenue by brand by month, or your ten least profitable SKUs last quarter.
Before you begin
- You need access to Financial Summaries. Administrators have it by default; other users need it granted in their role.
- The figures come from your sales orders' line financials. If an order's costs or prices changed recently, its numbers update after its financials are recalculated. See Check order line profit with Sales Order Financials.
Choose between Financial Summaries and the Profitability report
Both start from the same sales figures. Pick by the question you're asking.
| Financial Summaries | Profitability Report | |
|---|---|---|
| Metrics | One at a time | Several side by side |
| Costs counted | Cost of goods, plus the fees and other costs on each order | The same, plus overheads you record as cost entries |
| Groupings | Brand, Supplier, SKU, Sales Channel, Product Type, Sub Sales Channel | The same, plus product attributes and customer tags |
| Drill down | No | Down to each order |
| Best for | A quick period-by-period ranking or trend | Your true margin, and the reasons behind it |
Build the report
-
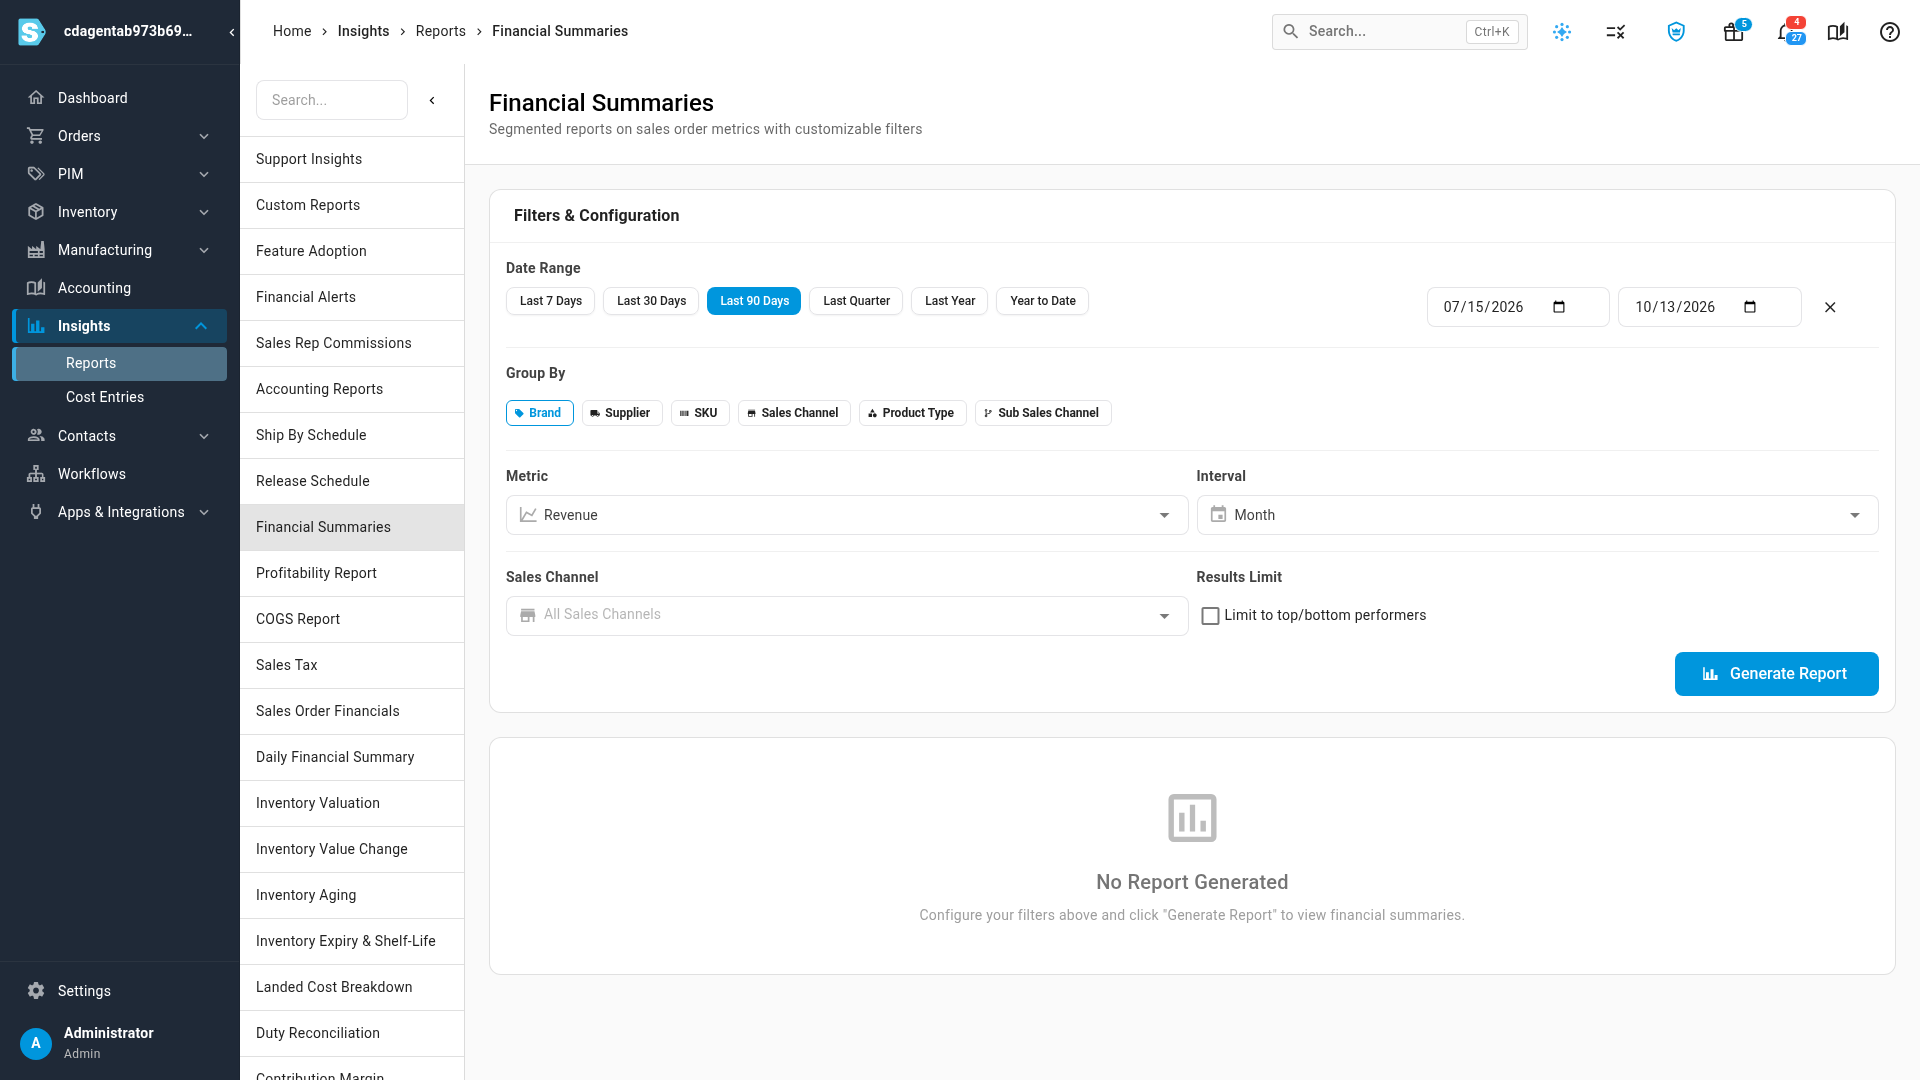
Go to Insights → Reports and choose Financial Summaries.
-
Under Date Range, choose a preset, or set the start and end dates in the two date fields:
Preset Covers Last 7 Days, Last 30 Days, Last 90 Days That many days up to today Last Quarter The previous calendar quarter, for example July 1 to September 30 Last Year The previous calendar year, January 1 to December 31 Year to Date January 1 of this year to today The × beside the dates clears them, so the report covers all time.
-
Under Group By, choose what each row stands for: Brand, Supplier, SKU, Sales Channel, Product Type, or Sub Sales Channel. Grouping by Supplier uses each product's default supplier.
-
Choose a Metric:
Metric What it adds up Revenue Revenue, including order-level charges, after refunds, credits, and discounts Profit Revenue less the cost of goods and the fees and other costs on each order Profit Margin Profit as a percentage of revenue Units Sold Units sold # of Orders Number of orders -
Choose an Interval for the columns: Day, Week, Month, Quarter, or Year.
-
Optionally, choose a Sales Channel to count only that channel's sales. Leave it on All Sales Channels to count them all.
-
Optionally, under Results Limit, tick Limit to top/bottom performers. Choose Top or Bottom, and how many rows to show.
-
Click Generate Report.
The filters fold into a summary row. Click it to change them, then click Generate Report again. Your choices are kept in the page's address, so you can bookmark or share a report; whoever opens it clicks Generate Report to run it. Reset All puts every filter back to its default.
Read the results
-
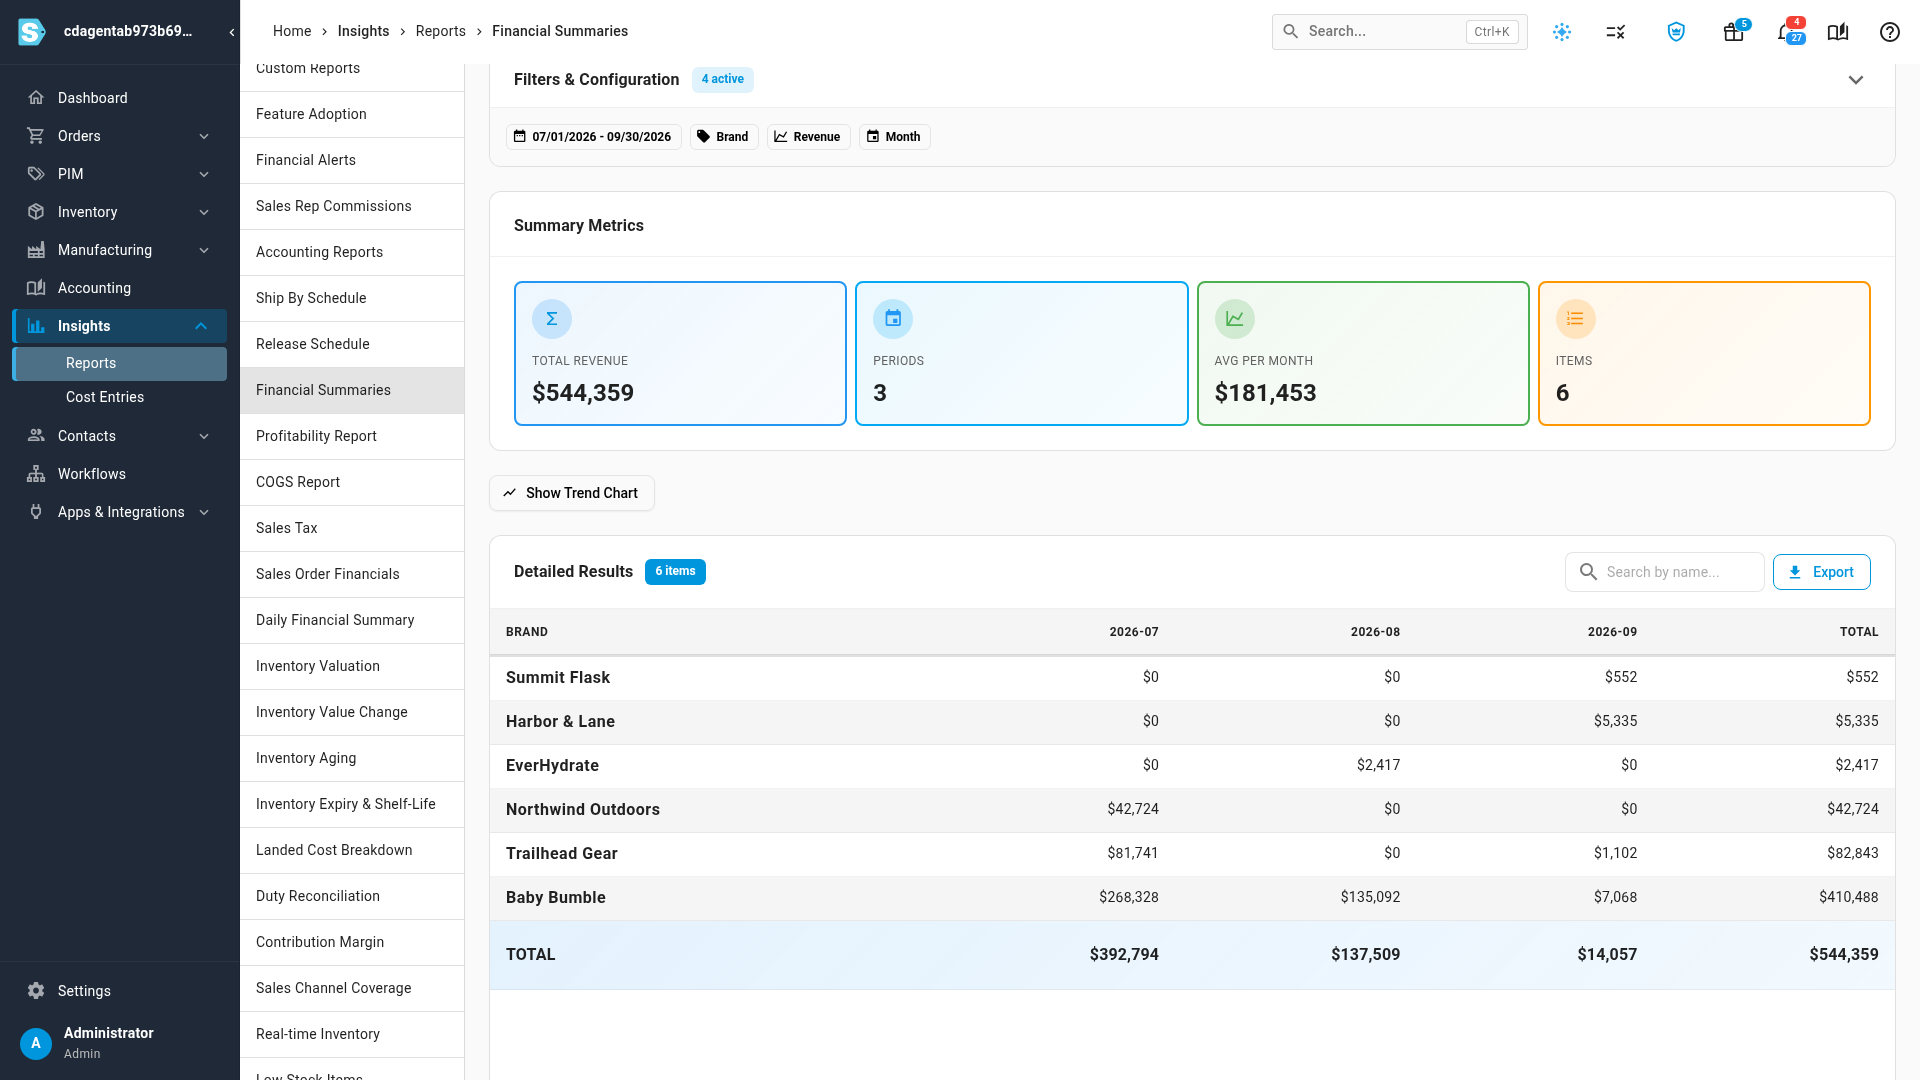
Summary Metrics gives the total for the whole report, the number of Periods, the average per period, and the number of Items, the rows in the table.
-
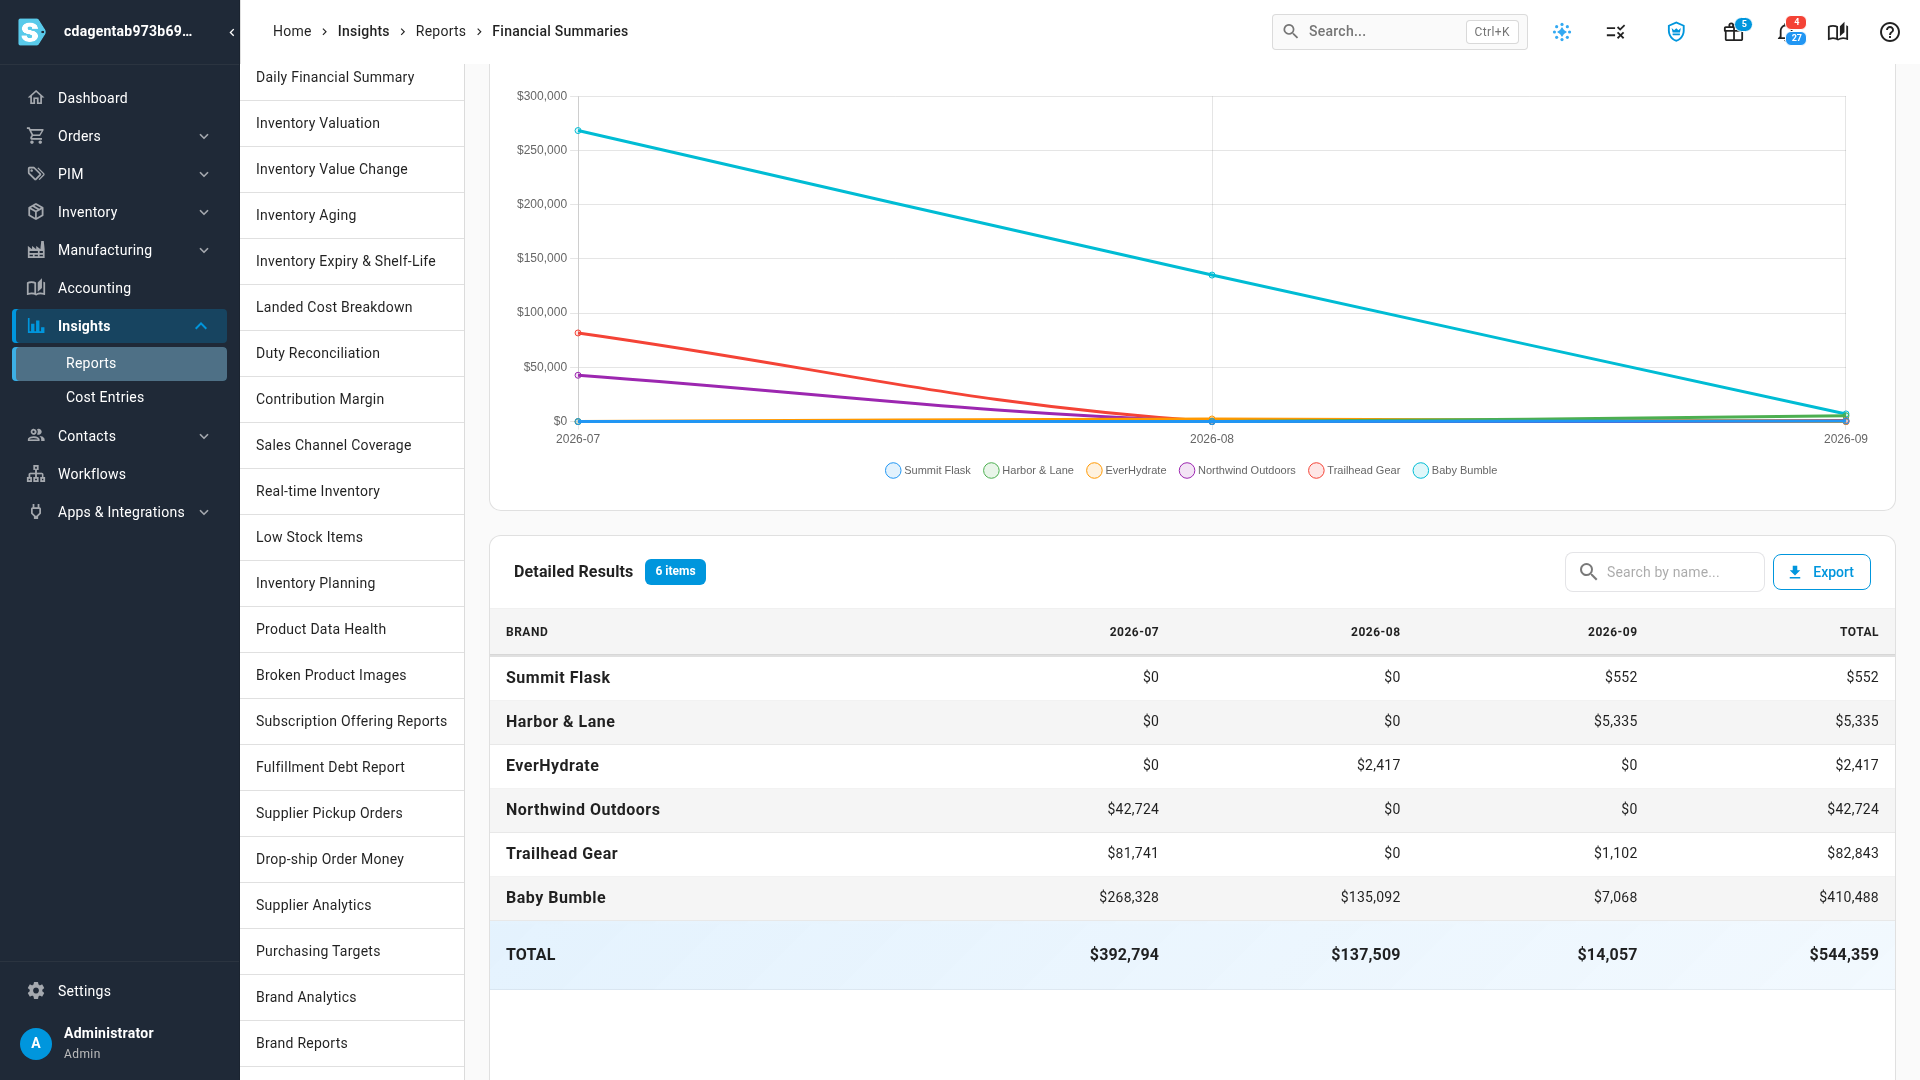
Click Show Trend Chart to plot each row across the periods. Switch the chart between a line and a bar chart with the buttons in its header. Hide Chart folds it away.
-
Detailed Results has one row per group and one column per period, with a TOTAL column on the right and a TOTAL row at the bottom. Type in Search by name to find a row.
Export the results
Click Export in Detailed Results to download the table as a CSV file, with one column per period and a TOTAL row at the end. The file holds every row of the report, even when you've typed in Search by name. Grouped by SKU, it also has each product's name, brand, and supplier.
Next steps
- Analyze profitability and drill down to the order for margins after overheads, and the orders behind each number.
- Check order line profit with Sales Order Financials for the line-by-line figures these totals are built from.
Video transcript
To see how each brand or channel sold, period by period, open Insights in the sidebar, and then choose Reports. In the list of reports, choose Financial Summaries. It breaks one number down by brand, supplier, or channel, period by period. Pick a date range, such as Last Quarter, which is the previous calendar quarter. Under Group By, choose what each row stands for, like Brand. Then choose one metric, such as Revenue, and an interval for the columns, like Month. To count one channel only, choose it under Sales Channel. To see a ranking, tick Limit to top or bottom performers. When everything is set, click Generate Report to build the summary. Summary Metrics gives the total, the number of periods, and the average per period. Detailed Results has a row for each brand, a column for each month, and totals along both. Click Show Trend Chart to plot each brand as a line across the months. Export downloads the table as a spreadsheet, totals included.