Analyze profitability and drill down to the order
Revenue tells you what sold. The Profitability Report tells you what you kept. It takes your sales and subtracts the cost of goods, the fees and other costs on each order, and the overheads you record as cost entries, then lets you slice the result by brand, supplier, channel, product type, or any product attribute. Every row drills down to the individual orders, and every order down to its own profit and loss.
Before you begin
- You need access to the Profitability Report.
- For true margins, your products need costs, so that cost of goods is right. To include overheads such as marketing, software, or rent, record them under Insights → Cost Entries first.
Set up the report
-
Go to Insights → Reports and open Profitability Report.
-
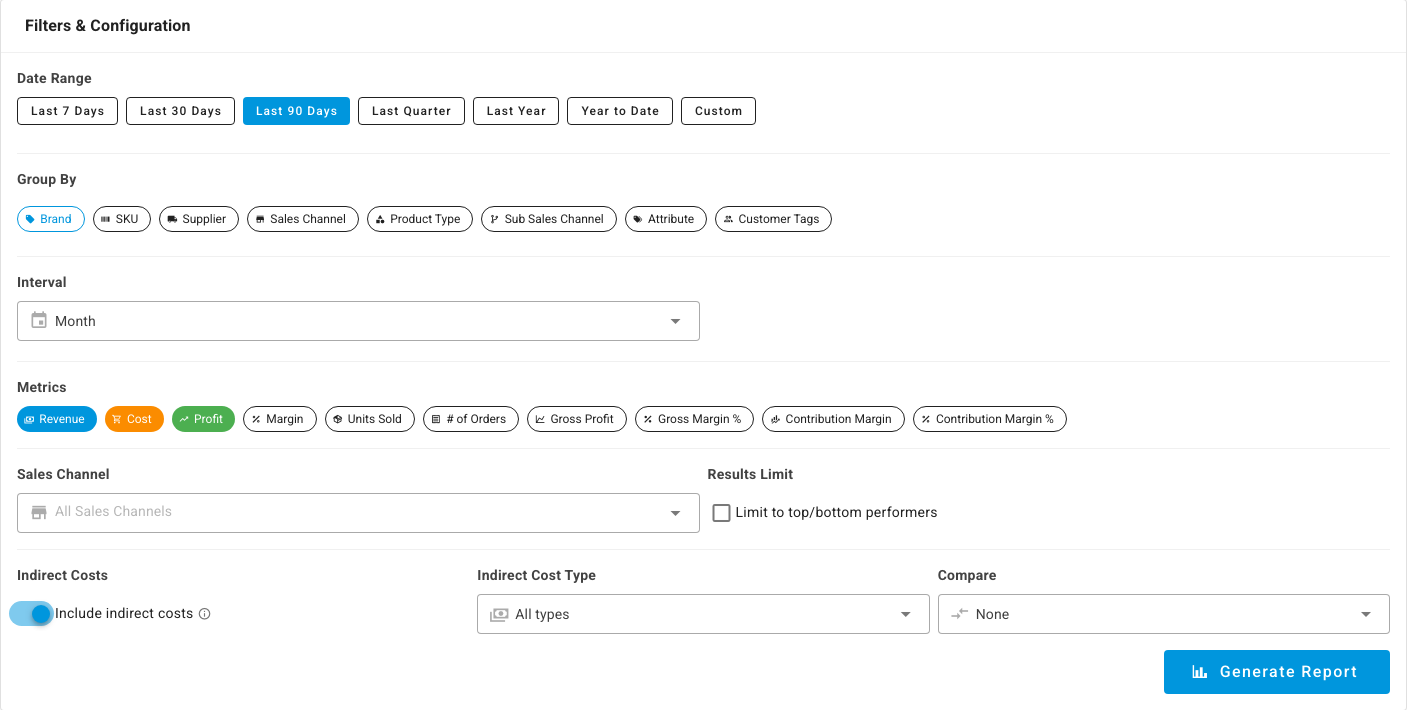
Under Date Range, choose a preset such as Last 90 Days or Year to Date, or Custom for your own dates.
-
Under Group By, choose what each row stands for: Brand, SKU, Supplier, Sales Channel, Product Type, Sub Sales Channel, Attribute, or Customer Tags.
-
Choose an Interval, such as Month, for the trend columns.
-
Under Metrics, pick the measures to show. Revenue, Cost, and Profit are on by default. You can add Margin, Units Sold, # of Orders, Gross Profit, Gross Margin %, Contribution Margin, and Contribution Margin %.
-
Optionally narrow or extend the report:
- Sales Channel limits it to one channel.
- Limit to top/bottom performers shows only your best or worst rows.
- Include indirect costs subtracts the overheads you recorded as cost entries. Use Indirect Cost Type to include only one type.
- Compare adds the Previous period or the Prior year next to each number.
-
Click Generate Report.
Group by any product attribute
To slice margin by something that isn't a built-in option, such as color, size, or material, group by a product attribute.
-
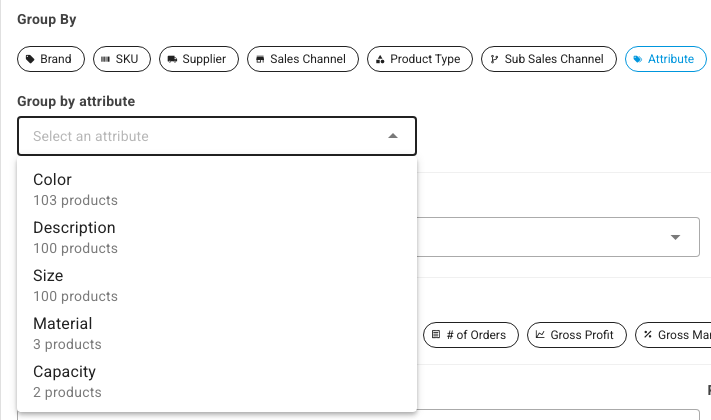
Under Group By, choose Attribute.
-
In Group by attribute, pick the attribute. Each one shows how many products carry it.
-
Click Generate Report.
Each row is now one value of the attribute, such as Blue or Red, with its revenue, cost, profit, and margin. To group by customer segment instead, see Segment the Profitability report by customer tag.
Read the margin ladder
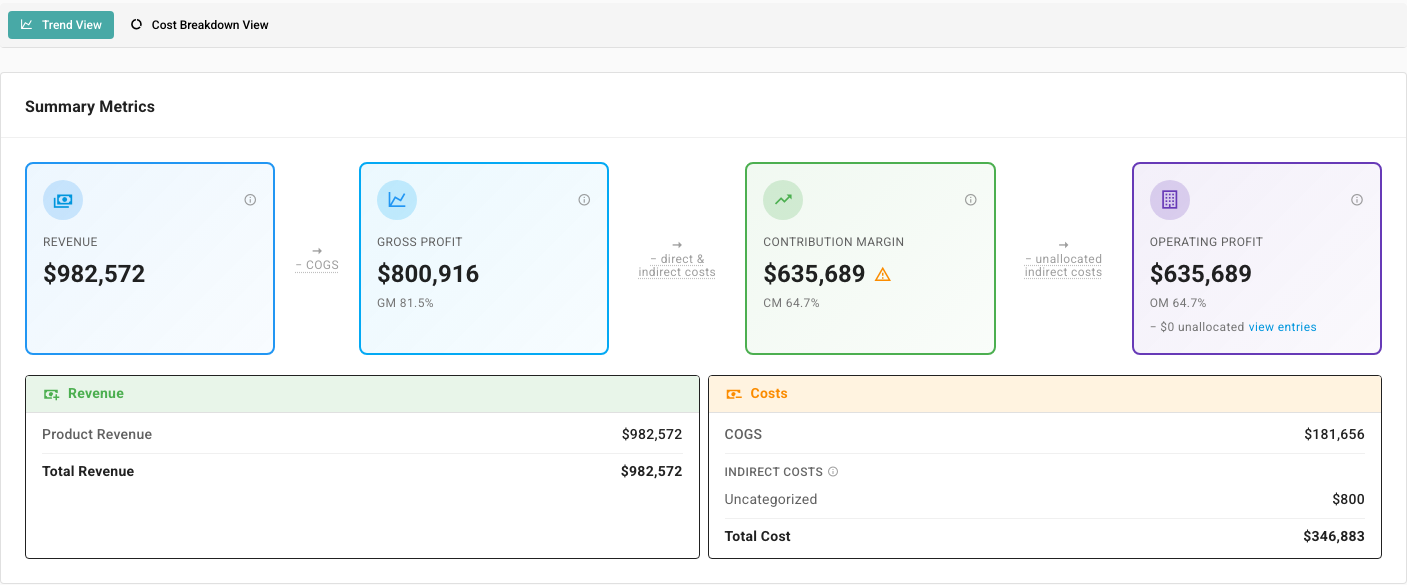
Summary Metrics walks your revenue down to profit in three steps:
- Revenue, then minus cost of goods gives Gross Profit.
- Minus direct costs, such as fees and shipping, and the indirect costs allocated to these sales gives Contribution Margin.
- Minus indirect costs that weren't allocated to any product, brand, or channel gives Operating Profit. Click view entries to see those costs.
Below the ladder, the Revenue and Costs cards list what makes up each side. Click the ⓘ on any tile to see how that number is worked out.
Two views sit above the summary:
- Trend View shows each row's revenue, cost, and profit for every interval, with totals and margin, and a trend chart below.
- Cost Breakdown View shows each row's revenue, COGS, gross profit, each type of cost line (such as commission, shipping, or FBA fees), indirect costs, contribution margin, and CM %. Click the arrow beside Indirect Costs to split them by type, or Ad metrics to add ad spend columns.
Sort any column to rank the rows. Click Export CSV to download either view.
Drill down to the orders
-
Click a row, such as a brand.
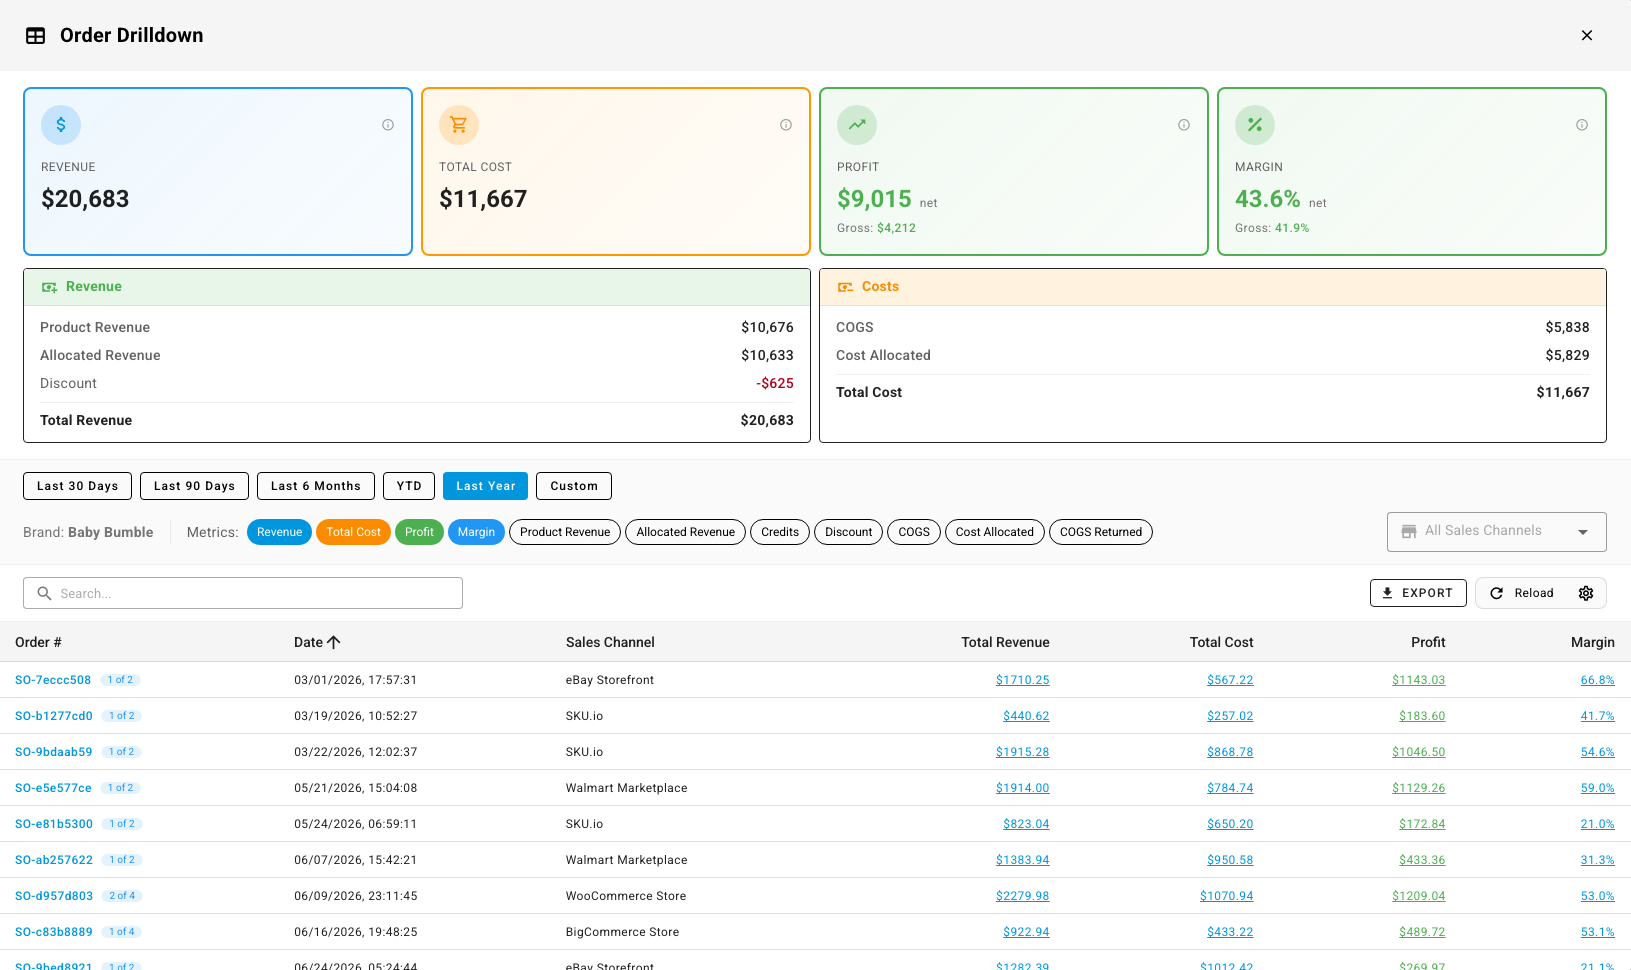
Order Drilldown opens with that row's revenue, total cost, profit, and margin, and the orders behind them.
-
Change the period with the presets, or add columns such as COGS, Cost Allocated, or Discount with the Metrics chips.
-
Click an order's revenue, cost, profit, or margin to open its own profit and loss: product lines, financial lines such as fees and shipping, allocated indirect costs, and the order's contribution margin.
-
Click the order number to open the sales order itself.
Next steps
- Read the Contribution Margin report: margin after overheads, by product, brand, supplier, or channel.
- Segment the Profitability report by customer tag: margin by customer segment.
- Monitor daily financials and margin alerts: get told when an order sells at a loss.