Check order line profit with Sales Order Financials
Sales Order Financials lists every sales order line with the money behind it: what it earned, what it cost, and the profit left over. Use it to check why an order made or lost money, to total revenue or profit for a filtered set of lines, or to export line-level figures for your own analysis. Every profit report in SKU.io is built from these figures.
Before you begin
- You need access to Sales Order Financials under Reports.
- For a true cost of goods, your products need costs. For how a line's figures reach your accounting, see How order financials flow to accounting.
Open the report
-
Go to Insights → Reports.
-
In the list of reports, choose Sales Order Financials.
Each row is one line of a sales order, the most recently added lines first.
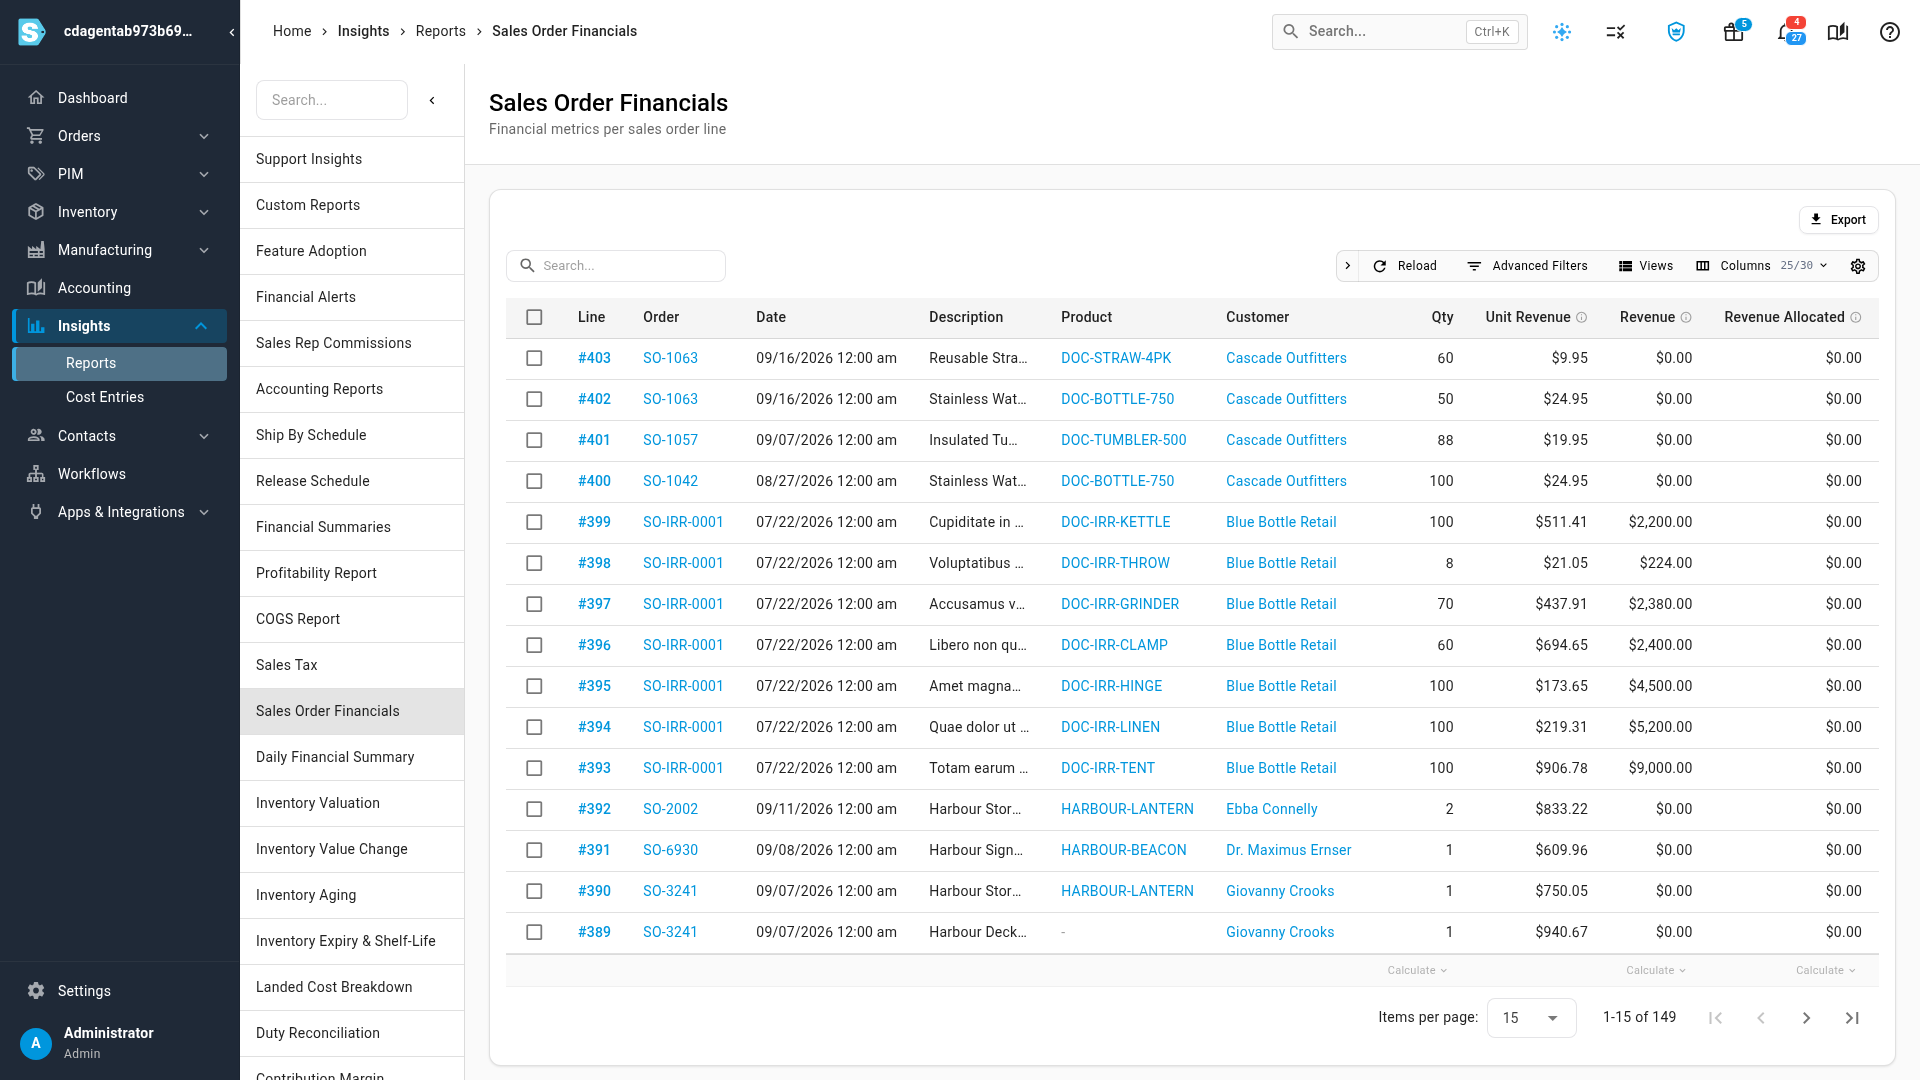
Read the columns
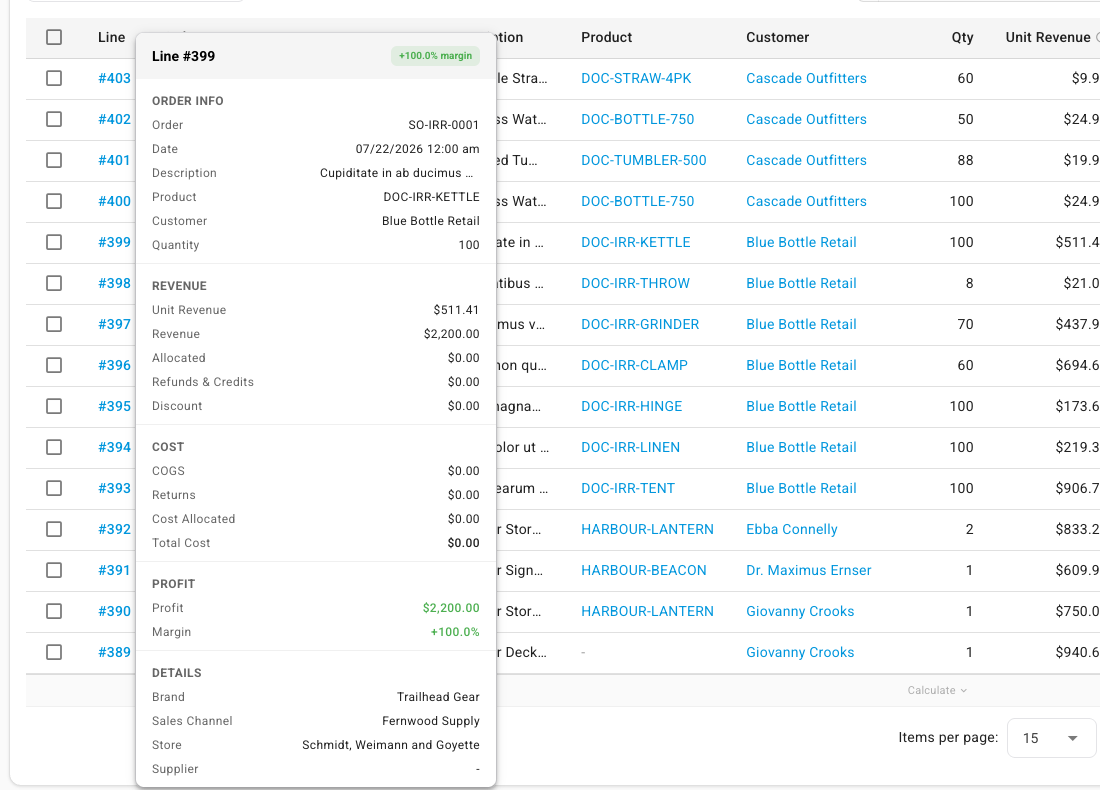
Point at the help icon in a column's header to see what it holds. Click a line's number in the Line column to see all of its figures in one panel.
| Column | What it shows |
|---|---|
| Line | The line's number. Click it to open the line's breakdown: order details, revenue, cost, profit, and a cost breakdown by type. With Show internal IDs on, this column is titled ID. |
| Order | The sales order. Click it to open the order. |
| Date | The order date and time. |
| Description | The line's description. |
| Product | The product's SKU. Click it to open the product in a new tab. |
| Customer | The customer. Click the name to open the customer in a new tab. |
| Qty | Units ordered. |
| Unit Revenue | The price per unit, in your base currency. |
| Revenue | Qty × Unit Revenue, before discounts. Tax is never included, even on tax-inclusive orders. |
| Revenue Allocated | The line's share of order-level revenue charges, such as package protection or gift wrapping. |
| Refunds & Credits | Refunds and sales credits against the line, plus its share of order-level credits. |
| Discount | Line discounts plus the line's share of order-level discounts. |
| COGS | Cost of goods sold: the cost of the stock the line used, or an estimated cost until it ships. |
| Returns | The cost of units returned to stock, which comes off the line's cost. |
| Cost Allocated | The line's share of order-level costs, such as marketplace fees, shipping, and 3PL fees. |
| Total Cost | COGS + Cost Allocated − Returns. |
| Profit | Revenue + Revenue Allocated − Refunds & Credits − Discount − Total Cost. Green when positive, red when negative. |
| % Margin | Profit as a percentage of revenue after credits and discounts. |
| Brand | The product's brand. Click it to open the brand. |
| Sales Channel, Sub Sales Channel, Store | Where the order came from. |
| Default Supplier | The product's default supplier today, not necessarily the supplier the stock came from. |
| Created At, Updated At | When the line's figures were first worked out and last recalculated. |
A few more columns are hidden by default: Local Date (the order date in your account's time zone), Order Status, Fulfillment Status, SKU, and Allocation. Allocation reads Document when revenue is as priced on the order, or Cost-corrected when a bundle's revenue is spread across its components in proportion to their cost. Use Columns to show, hide, or reorder columns. See Choose and freeze table columns.
Find the lines you want
- Search finds lines by SKU, Order #, Customer, Brand, Supplier, Store, Channel, or Description.
- Advanced Filters filters on any column, grouped into Order, Product, Customer, Sales Channel, Financial, and Dates. For example, set Profit less than 0 to find every line that lost money, or Order Date to a month. Each filter shows as a chip above the table; click a chip to change it, or its × to remove it.
- Views saves the search, filters, and columns as a view you can return to. See Save and pin table views.
Total a column
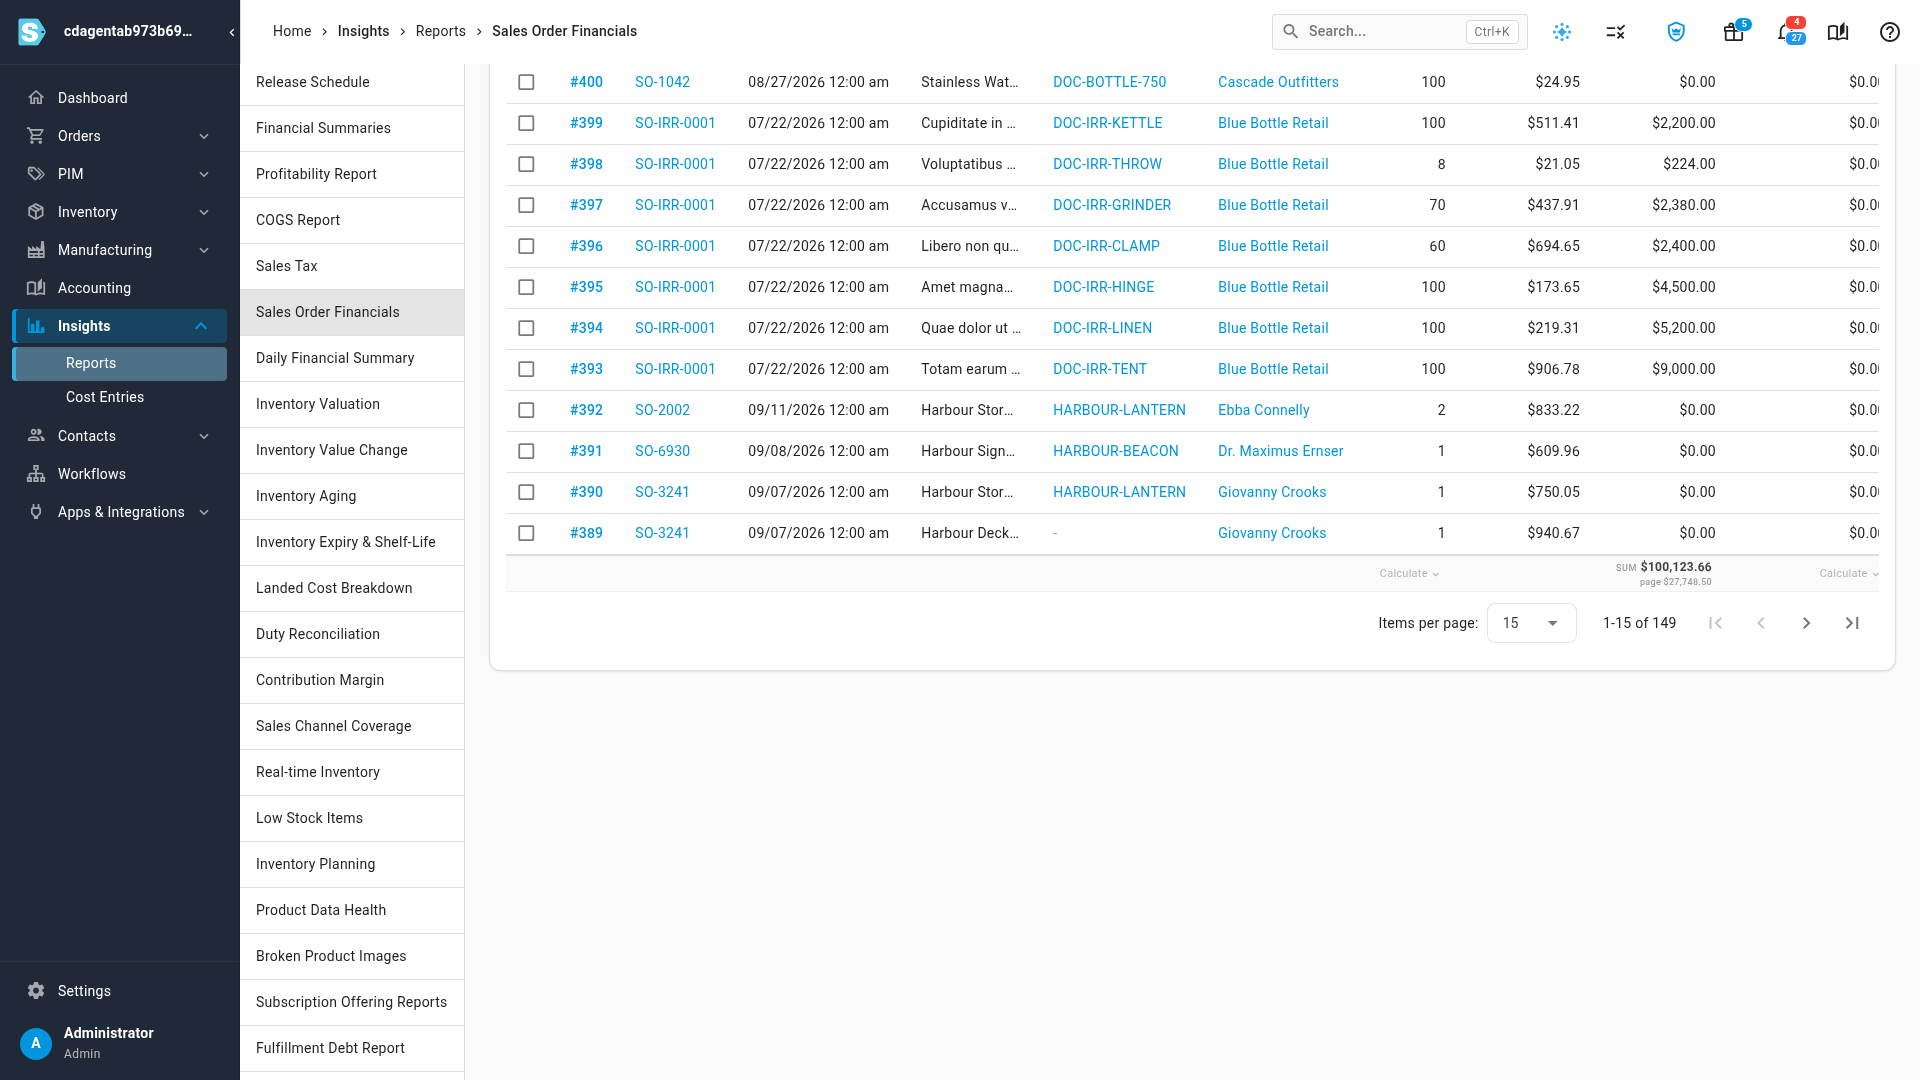
At the bottom of the table, click Calculate under a number column, such as Revenue or Profit, and choose Sum. The total covers every line that matches your search and filters, not only the page on screen. When you've selected rows, you can total only those. See Calculate column totals.
Export the list
- Click Export.
- Choose what to export: the selected rows, the current page, the lines that match your filters, or all lines.
- Choose CSV or Excel, and export.
Up to 1,000 lines download straight away. A bigger export runs in the background; follow it in the job tray. If you're still on the page when it finishes, the file downloads by itself. The file has the columns ID, Order, Date, Description, Product, Customer, Quantity, Unit Revenue, Revenue, Revenue Allocated, Allocation, Refunds & Credits, Discount, COGS, Returns, Cost Allocated, Total Cost, Profit, Profit Margin, Brand, Sales Channel, Sub Sales Channel, Store, Default Supplier, Created At, and Updated At, whatever columns you show on screen.
Recalculate lines after a change
SKU.io works out each line's figures when the order changes, and again when costs arrive, such as a stock receipt or a marketplace fee. Recalculate when a line's figures look out of date, for example after you corrected a product's cost or edited an order's prices.
-
Tick the lines to recalculate. To recalculate every line that matches your filters, tick the box in the header and choose to select all of them.
-
In the bar that appears above the table, click Recalculate.
-
In Recalculate Financials, click Recalculate.
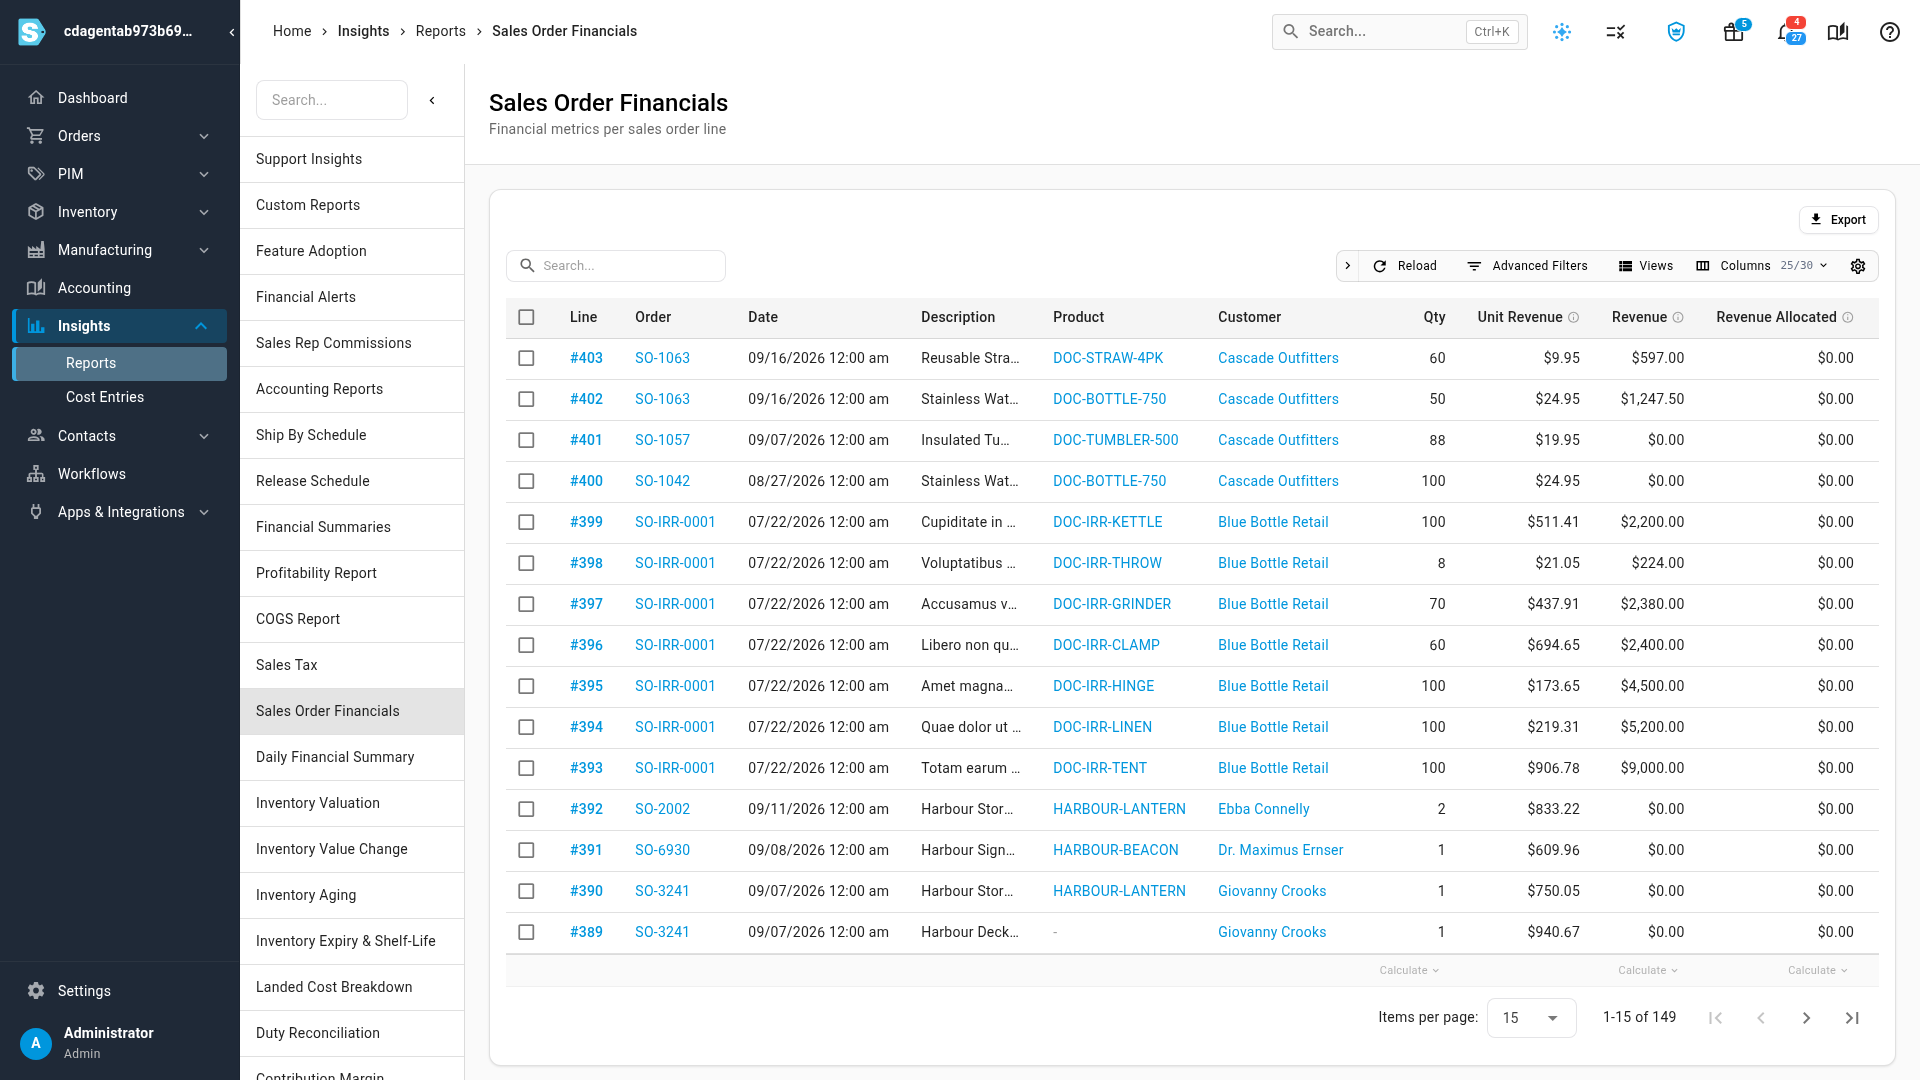
Lines you ticked are recalculated straight away, and the table reloads with the new figures. When you selected every matching line, SKU.io says Recalculations processing in the background: it may take a few minutes, so click Reload later to see the new figures.
Next steps
- Segment sales with Financial Summaries to total these figures by brand, supplier, or channel, period by period.
- Analyze profitability and drill down to the order for margins after overheads.
- How order financials flow to accounting
Video transcript
To check what each order line earned and cost, open Insights in the sidebar, and then choose Reports. In the list of reports, choose Sales Order Financials. Each row is one line of a sales order, with its revenue, its costs, and the profit left over. Revenue is quantity times the unit price. Revenue Allocated is the line's share of order-level charges. Then come refunds, discounts, and the cost of goods. Cost Allocated is the line's share of fees and shipping, and Profit is what's left. Point at a column's help icon to see how it's worked out. Click a line's number to see its whole breakdown in one place: order details, revenue, cost, and profit. Click outside the panel to close the breakdown. This line shows no revenue, because its figures are out of date. Tick the box at the start of the line, and click Recalculate in the bar that appears above the table. Then confirm with Recalculate. The line now shows its revenue, its cost of goods, and its profit. To total a column, scroll down to the summary row at the bottom of the table. Click Calculate under the column you want, then pick the total from the list of calculations. The total covers every line that matches your search and filters, across all pages. Use Search to find lines by SKU, order number, or customer name. Advanced Filters narrows the list on any column, such as profit below zero. Export downloads the lines as a spreadsheet.