Choose how much sales history drives daily average consumption
Every product carries a daily average consumption, shown as DAC: the units it sold over a recent window, divided by the number of days in that window. SKU.io uses it to work out how long your stock will last. The Sales History setting decides how long that window is, for every product at once.
A short window reacts quickly when demand changes. A long window smooths out spikes and quiet weeks, which suits slow or seasonal sellers.
Before you begin
- You need permission to change settings.
- One window applies to every product. You can't set it per product.
Steps
-
Go to Settings, open Inventory, then click Sales History.

-
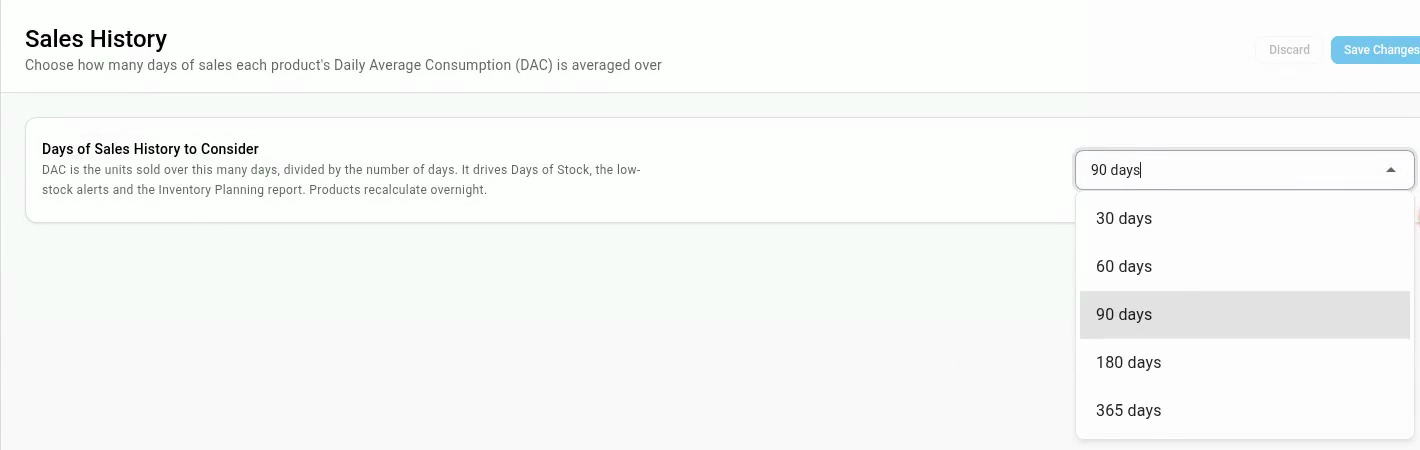
Open Days of Sales History to Consider and choose a window: 30 days, 60 days, 90 days, 180 days, or 365 days. The default is 90 days.
-
Click Save Changes.
Products pick up the new window when their DAC is next worked out. That happens overnight for every product, and shortly after a product sells. To refresh one product now, open it and click Refresh inventory cache in the stock bar at the top.
How the window changes the numbers
DAC divides the units sold by the full number of days in the window, including days with no sales. So the same sales history gives a different DAC depending on the window:
| What the product sold | With 30 days | With 90 days |
|---|---|---|
| 90 units in the last 30 days, and nothing before that | 3.0 a day | 1.0 a day |
| 30 units a month, every month | 1.0 a day | 1.0 a day |
A product with steady sales looks the same in any window. A product whose sales just jumped, or just stopped, looks different in each.
Where daily average consumption is used
- Products: the DAC and Days of Stock figures in the stock bar at the top of each product, and the DAC column on the products list. Days of Stock is available stock divided by DAC.
- Low stock: the Low Stock Items report and the low-stock count on the dashboard, which flag products that will run out within your threshold.
- Inventory Planning report: the Daily Avg and Days of Stock columns, and the stockout-risk and overstock figures built from them.

The Inventory → Demand Planning forecast doesn't use this setting. Each forecast reads the sales date range you set on the forecast itself.
Next steps
- How sales velocity and days of supply work: how Days of Stock and the other velocity figures are worked out.
- Use the Inventory Planning report: see stock, velocity, and reorder suggestions for every product.
Video transcript
SKU.io measures how fast each product sells from a stretch of recent sales. You choose how many days that covers. Open Settings, at the bottom of the sidebar. Click the Inventory card to expand its list. Then click Sales History. Click Days of Sales History to Consider to see the choices. Thirty days reacts quickly when demand changes. Longer periods smooth out spikes and quiet weeks, which suits slow or seasonal sellers. Pick the number of days you want. Then click Save Changes, and the confirmation appears. Every product picks up the new setting overnight. To check a product, open PIM in the sidebar, and choose Products from its list. Search for the item you want to check. Click its SKU to open the product page. The bar at the top shows the daily average consumption, as DAC. Days of Stock is what's available, divided by DAC. Low stock alerts and reorder reports use these same figures.