Check how far to trust a forecast
Every line of a demand forecast carries a confidence rating. It tells you how much sales history stands behind the recommended quantity, so you can approve the steady sellers quickly and spend your review time on the lines that need judgment. Next to the rating, each line shows a likely range: the band the right order quantity probably falls in.
Before you begin
- Build a forecast on Inventory → Demand Planning. See Forecast demand and replenish stock. Confidence always reflects the product's real sales history, whichever forecast type you choose.
Read the confidence column
-
Go to Inventory → Demand Planning and build a forecast.
-
In the results table, find the Conf column. Each line shows one of four tiers:
Tier What it means High Strong, steady sales history behind this number. You can trust the reorder quantity. Medium Decent history with some gaps or day-to-day swings. Reasonable, but worth a sanity check. Low Sparse or erratic sales. Treat the reorder quantity as a rough guide, not a firm number. New Too little sales history yet: under 30 days of selling, or fewer than 6 units sold. It's an early estimate that sharpens as sales come in. -
Look under the quantity in the Qty column. The smaller numbers, for example 264–378, are the line's likely range. A narrow range means demand is predictable; a wide one means the right quantity could land well above or below the suggestion.

See why a line got its rating
- Hover over a confidence chip. The tooltip shows the tier, the score out of 100, and the four signals behind it, each marked as fine, borderline, or a problem.
- Read How to improve at the bottom of the tooltip for what would raise the rating.
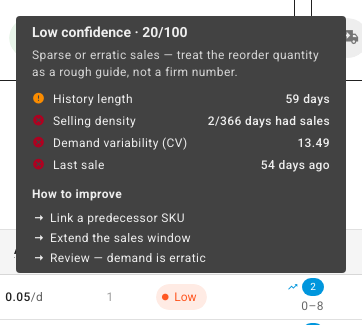
The four signals are:
| Signal | What it measures | Healthy when |
|---|---|---|
| History length | How long the product has been selling within your history window. | It reaches about 90 days. |
| Selling density | How many days in the window had at least one sale. | At least half the days had a sale. |
| Demand variability (CV) | How much daily sales swing compared to the average. | The value is well below 1. At 1 or more, demand is erratic. |
| Last sale | How recently the product last sold. | Recently. At 30 days or more without a sale, this signal counts for nothing. |
History length and selling density weigh the most, followed by variability, then the last sale. The weighted result is the score out of 100: 40 or less is Low, 41 to 70 is Medium, and above 70 is High.
Open the full explanation
- Click the calculator icon at the end of a line to open its calculation details.
- Read the one-line summary at the top, for example "Ordering 321: 72 days of history at 6.36/day, 14-day lead time, 150 available." It explains the quantity in plain words.
- Scroll to Confidence. It repeats the tier and the likely range, lists each signal with its value, and gives the reasons under Why.
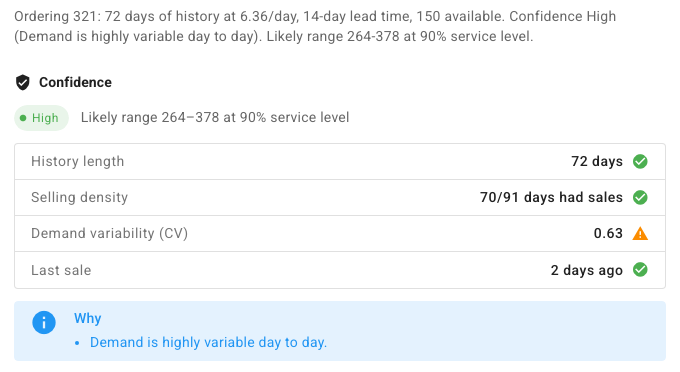
The likely range is set at a 90% service level: if demand behaves the way it has, the right quantity lands inside the range about 9 times out of 10.
Check how accurate past forecasts were
Confidence looks at the sales history behind a forecast. Forecast Accuracy looks back at results: how close earlier forecasts for the same product came to what then sold. It's measured per product, from your own forecasts, so you can see whether a product's numbers usually run high, low, or close.
-
Click the calculator icon at the end of a line to open its calculation details.
-
Scroll to Forecast Accuracy. Three chips sum up the scored forecasts:
Chip What it means Avg error The average size of the miss, as a percentage of what actually sold. Lower is better. Bias The average miss with its direction. A plus figure, labeled over-forecast, means forecasts ran high, so you bought more than you sold. A minus figure, labeled under-forecast, means they ran low, which risks stockouts. Tracking signal Whether the misses keep going the same way. Between −4 and +4 the forecast isn't drifting. Beyond that, the chip turns red and reads drifting: the forecast is consistently off in one direction and worth reviewing. -
Read the table below the chips. Each row is one forecast run:
Column What it shows Run The forecast run that was scored. Click it to open the run. Runs that created no purchase orders are cleared 37 days after they ran. Their scores stay, and the run number shows as plain text with no link. Scored window The 30 days the forecast was compared against. Forecast The units the run expected to sell in those 30 days. Actual The units that sold. Error How far off the forecast was, as a percentage of what sold. Bias The same miss with its direction: plus when the forecast ran high, minus when it ran low.
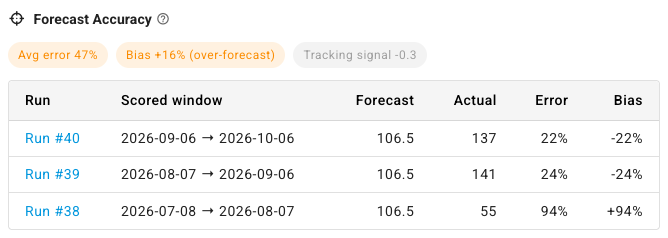
In this example the newest run missed by 22% and the oldest by 94%, so the forecasts for this bottle are getting closer. The forecasts ran low lately (minus bias), and with a tracking signal of −0.3 the misses aren't drifting one way.
When the numbers appear
Accuracy comes from forecasts that run on a schedule. Each scheduled run is scored once, 30 days after it ran, by comparing what it forecast for those 30 days with what sold. SKU.io does this overnight, so a run's row appears the morning after its 30 days are up. Forecasts you build by hand on the Demand Planning page aren't scored.
Until a product has a scored run, the section reads Not scored yet.

To start building a history, replenish on a schedule.
What to do with it
- Low average error: the forecast has been reliable for this product. Confidence and accuracy together tell you to order with little review.
- Consistent plus bias: you've been over-buying. Check for one-off spikes that inflate the average and review demand anomalies.
- Consistent minus bias, or drifting: demand is outgrowing the forecast. A trend-aware baseline may follow it better.
Decide what to do with each tier
- High: order the suggested quantity.
- Medium: compare the suggestion with the likely range and your own knowledge of the product, then adjust the quantity if needed.
- Low: treat the suggestion as a starting point. A longer Days of History window often helps a slow seller, because more selling days count toward the score. If demand is erratic, check the sales history for one-off spikes and review demand anomalies.
- New: order cautiously, close to the low end of the range, and rebuild the forecast as sales come in.
Next steps
- Review demand anomalies to keep one-off spikes and drops out of the average.
- Forecast with trend-aware baselines to see how each line's daily rate is built.
- Replenish stock on a schedule once you trust a supplier's forecast enough to run it automatically.