Adjust velocity for out-of-stock days
A product that sells out sells nothing until it's restocked, and those empty days still count in a plain average. Its velocity comes out lower than its real demand, so the next order is too small and it runs out again. With Adjust for out-of-stock days on, a sales-based forecast measures velocity over the days the product could sell instead of every calendar day.
The option is on for every new forecast. This guide shows where it lives, how to read the lines it changed, and when it leaves a line alone.
Before you begin
- You need a supplier with products and sales in the forecast's sales window, and a Sales Based forecast type.
- SKU.io works out which days a product was out of stock from its stock history, so the products need stock movements in SKU.io. Products you have never held in stock, such as drop-shipped items, are never adjusted.
Steps
-
Go to Inventory → Demand Planning.
-
In Configuration, open Sales Order Filters.
-
Check that Adjust for out-of-stock days is selected. It's on for new forecasts. A configuration you saved before the option existed loads with it off, so select it there yourself.

-
In Suppliers, choose the supplier to forecast.
-
Click Build Forecast.
-
In the To Order list, find lines with a badge next to the Avg/d figure. The badge means the stockout adjustment changed that product's velocity. Hover the badge to see how.

-
Review any line with an orange badge before you order. Its velocity hit the cap described below.

-
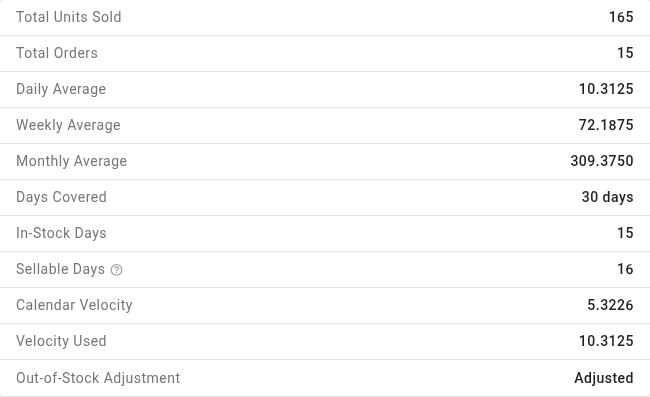
To see the full working, click the calculator icon on the line. The Sales History section lists In-Stock Days, Sellable Days, Calendar Velocity, Velocity Used and Out-of-Stock Adjustment.
-
To keep the setting, click Save Config.
What the adjustment does
The forecast divides the units sold in the window by the product's sellable days instead of by every day in the window. A sellable day is a day the product was in stock, or a day it was out of stock but still sold on backorder. A day it sold out still counts, because it sold that day.
For example, a product that sold 165 units in a 31-day window, but was in stock for only the first 16 of those days, has a calendar velocity of 5.32 a day (165 ÷ 31). Adjusted, it's 10.31 a day (165 ÷ 16). On a 30-day target with a 14-day lead time and nothing on hand, the suggested order goes from 234 to 454.
Days before a new product first arrived in stock don't count as out-of-stock days, so a product launched mid-window is measured from its launch.
The adjustment works the same way with every Baseline method. If you also exclude detected anomalies, a day that was both out of stock and excluded is left out once, not twice.
Read the badges
Hover any badge to see the in-stock days, the sellable days, and the calendar velocity next to the one the forecast used.
| Badge | When | Velocity used |
|---|---|---|
| No badge | The product was in stock every day of the window, so Calculation Details shows No stockouts in window. Or the option is off. | The calendar velocity: nothing to adjust. |
| Adjusted (blue) | The product was out of stock for part of the window. | Units sold ÷ sellable days. |
| Capped at 3× (orange) | The adjusted velocity would be more than three times the calendar velocity, usually because the product was restocked only a few days ago. | Three times the calendar velocity. Check the line before you order. |
| Not adjusted (grey) | The product had fewer than 7 sellable days in the window (fewer than half the window, for a window shorter than 14 days). | The calendar velocity, because a few days of sales are too little to judge demand. |
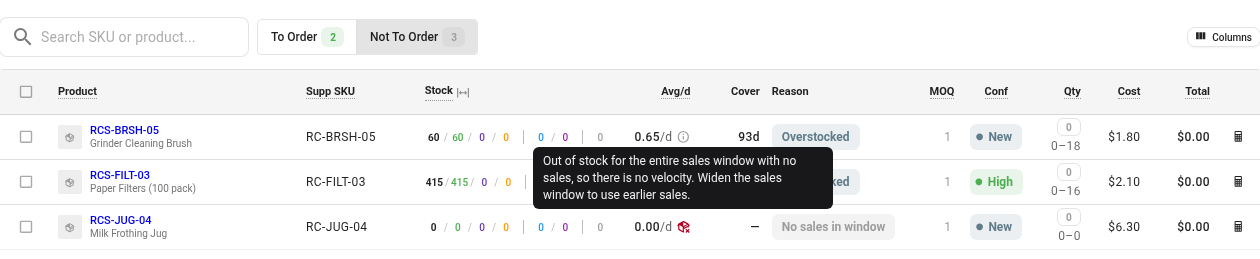
| Out of stock all window (red) | The product was out of stock for the whole window and sold nothing. | None. Widen the sales window to use the sales from before it sold out. |
Lines whose stock already covers the target, and products with no velocity, appear under Not To Order. Their badges work the same way.
Turn the adjustment off
Clear Adjust for out-of-stock days in Sales Order Filters and click Build Forecast again. Every line goes back to calendar-day velocity, and the badges and the stockout rows in Calculation Details disappear.
In the export
When you export the forecast with Include calculation details selected, the file has four extra columns: In-Stock Days, Sellable Days, Calendar Velocity and Stockout Adjustment. They're empty when the option is off. Stockout Adjustment uses the same words as the badges: Adjusted, Capped at 3×, Not adjusted, Out of stock all window, or No stockouts in window for a product that was in stock the whole time.
Next steps
- How sales velocity and days of supply work: what a stockout does to velocity in each part of SKU.io.
- Review demand anomalies: remove spikes and other days that aren't normal demand.
- Check how far to trust a forecast: see which reorder quantities need a second look.
Video transcript
When a product sells out, the days it couldn't sell still count as zero sales. Its average drops, and the next order comes out too small. To measure velocity the right way, open Inventory in the sidebar, then choose Demand Planning. Expand Sales Order Filters, near the bottom of the configuration. Adjust for out-of-stock days is already selected for every new forecast. Velocity is then measured only over the stretch a product could sell, not the whole calendar. Now choose your supplier from the Suppliers list. Type part of the name to find it quickly. Then click Build Forecast, at the bottom of the configuration. Give it a moment. The results load below, with one line for each product. This dripper sold out in the middle of the month. A blue badge beside its daily average means the velocity was adjusted. Hover it to compare the days in stock with the calendar figure. This tamper came back in stock only eight days ago. The adjustment never goes above three times the calendar velocity, and an orange badge marks a capped line. Review it before you order. Switch to the Not To Order tab for everything else. An item in stock for too few days keeps its calendar velocity. One that had nothing to sell for the whole window shows zero. Back on the To Order tab, click the calculator icon at the end of a line. Its Sales History section lists the in-stock days and the sellable days. Then the calendar velocity, and finally the velocity the order actually used.