See how much of your sales SKU.io can see, and what to fix first
Every report in SKU.io can only count the sales and products it knows about. Product Data Health tells you how much of what you sold actually reached SKU.io, lists every gap ranked by the share of sales it hides, and links each gap to its fix. Below that, it audits the completeness of your whole catalog.
The page only explains and links. It never changes your products, imports or orders. You make the fixes on the screens its links open.
Before you begin
- Your role needs access to the Product Data Health report. If you can open it from Insights → Reports, you have it.
- Sales coverage is measured for Shopify stores today. If you also sell on another channel, the page says that channel isn't measured yet, and the product checks still cover your whole catalog.
- The first check on a large catalog runs in the background and can take a few minutes. You can leave the page and come back.
Steps
- Go to Insights → Reports, then select Product Data Health. You can also select Review on the coverage banner that appears on reports that only see part of your sales.
- Read the sales coverage card at the top: the share of units and revenue sold on Shopify in the last 12 months that SKU.io can see.
- Work down What to fix first, starting at the top. Each gap shows its count, the share of sales affected, a plain explanation and an action.
- Select the arrow on a gap to open its breakdown, then use the action on the row that matches your situation.
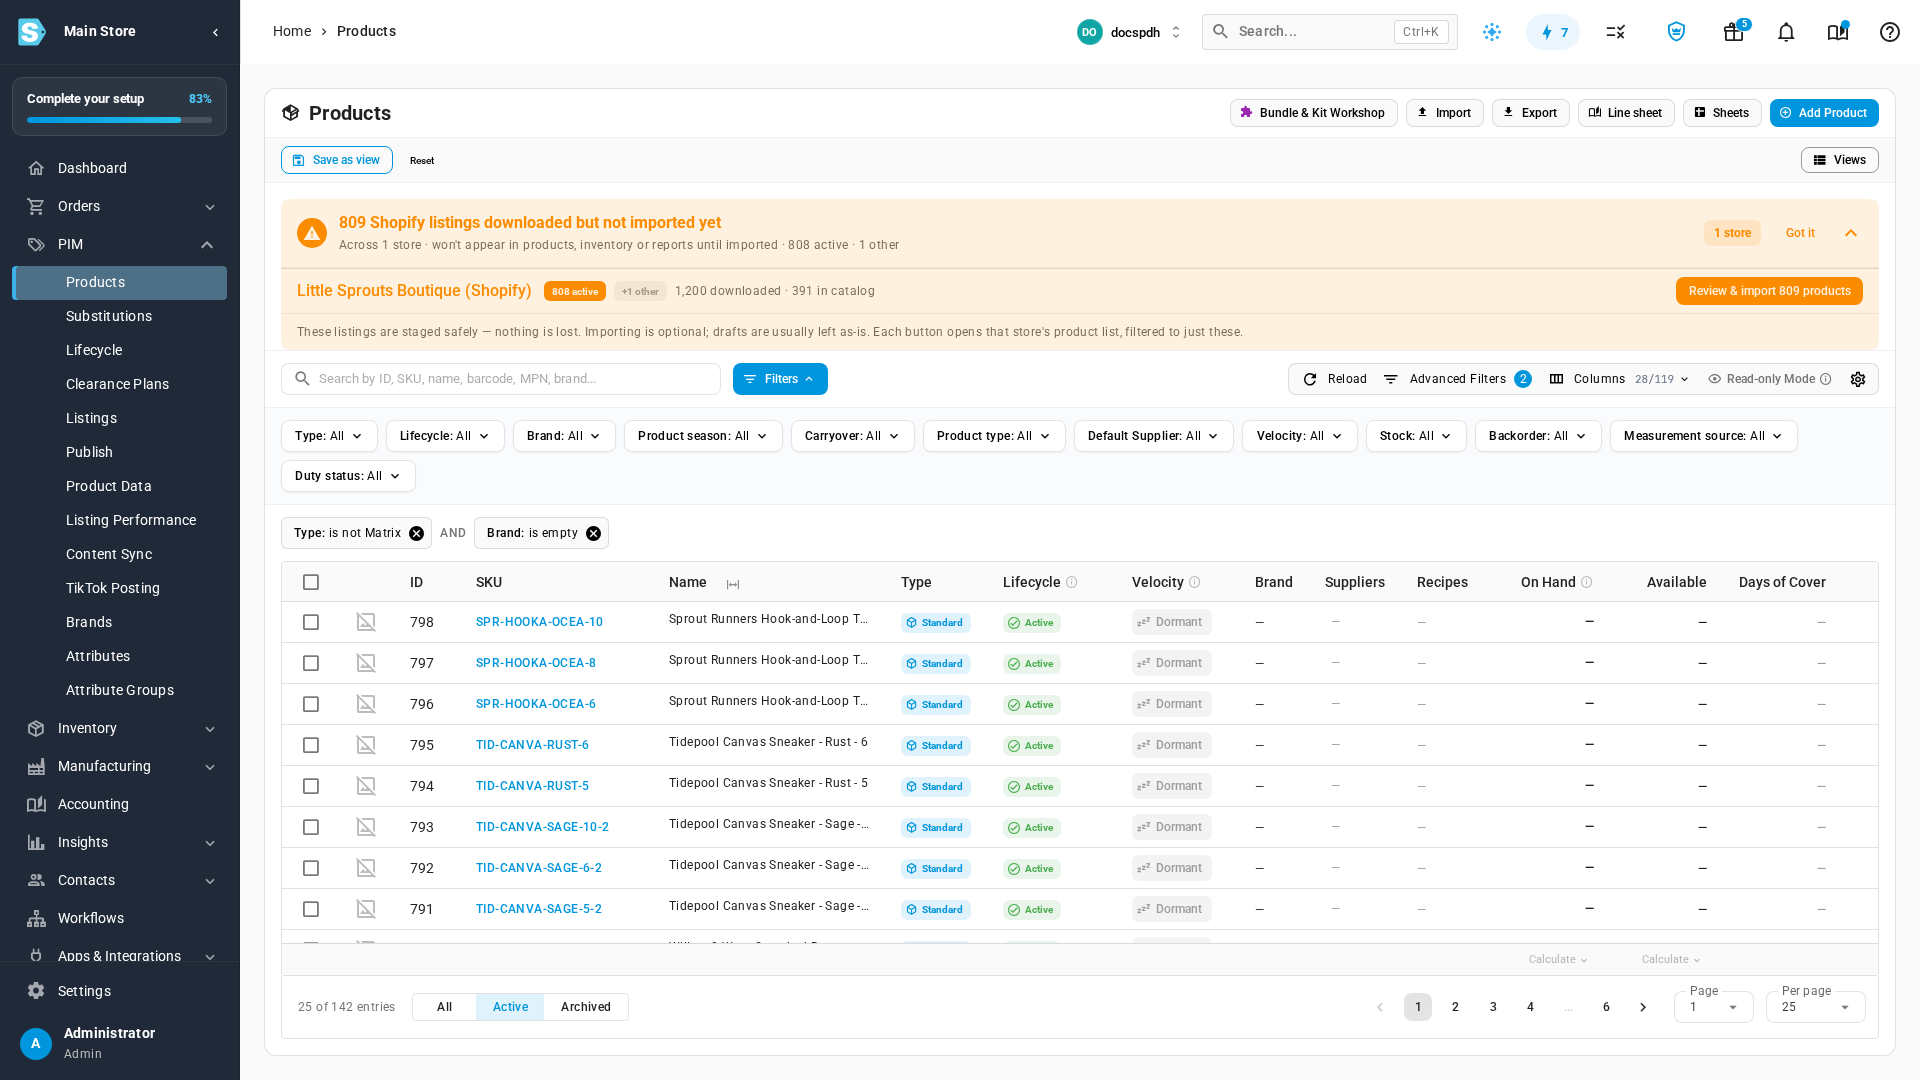
- Scroll to Catalog completeness to review the Buyer attribute health card and the catalog cards below it. Select any count to open exactly those products.
- After you fix something, select Re-check on the coverage card.
Read your sales coverage
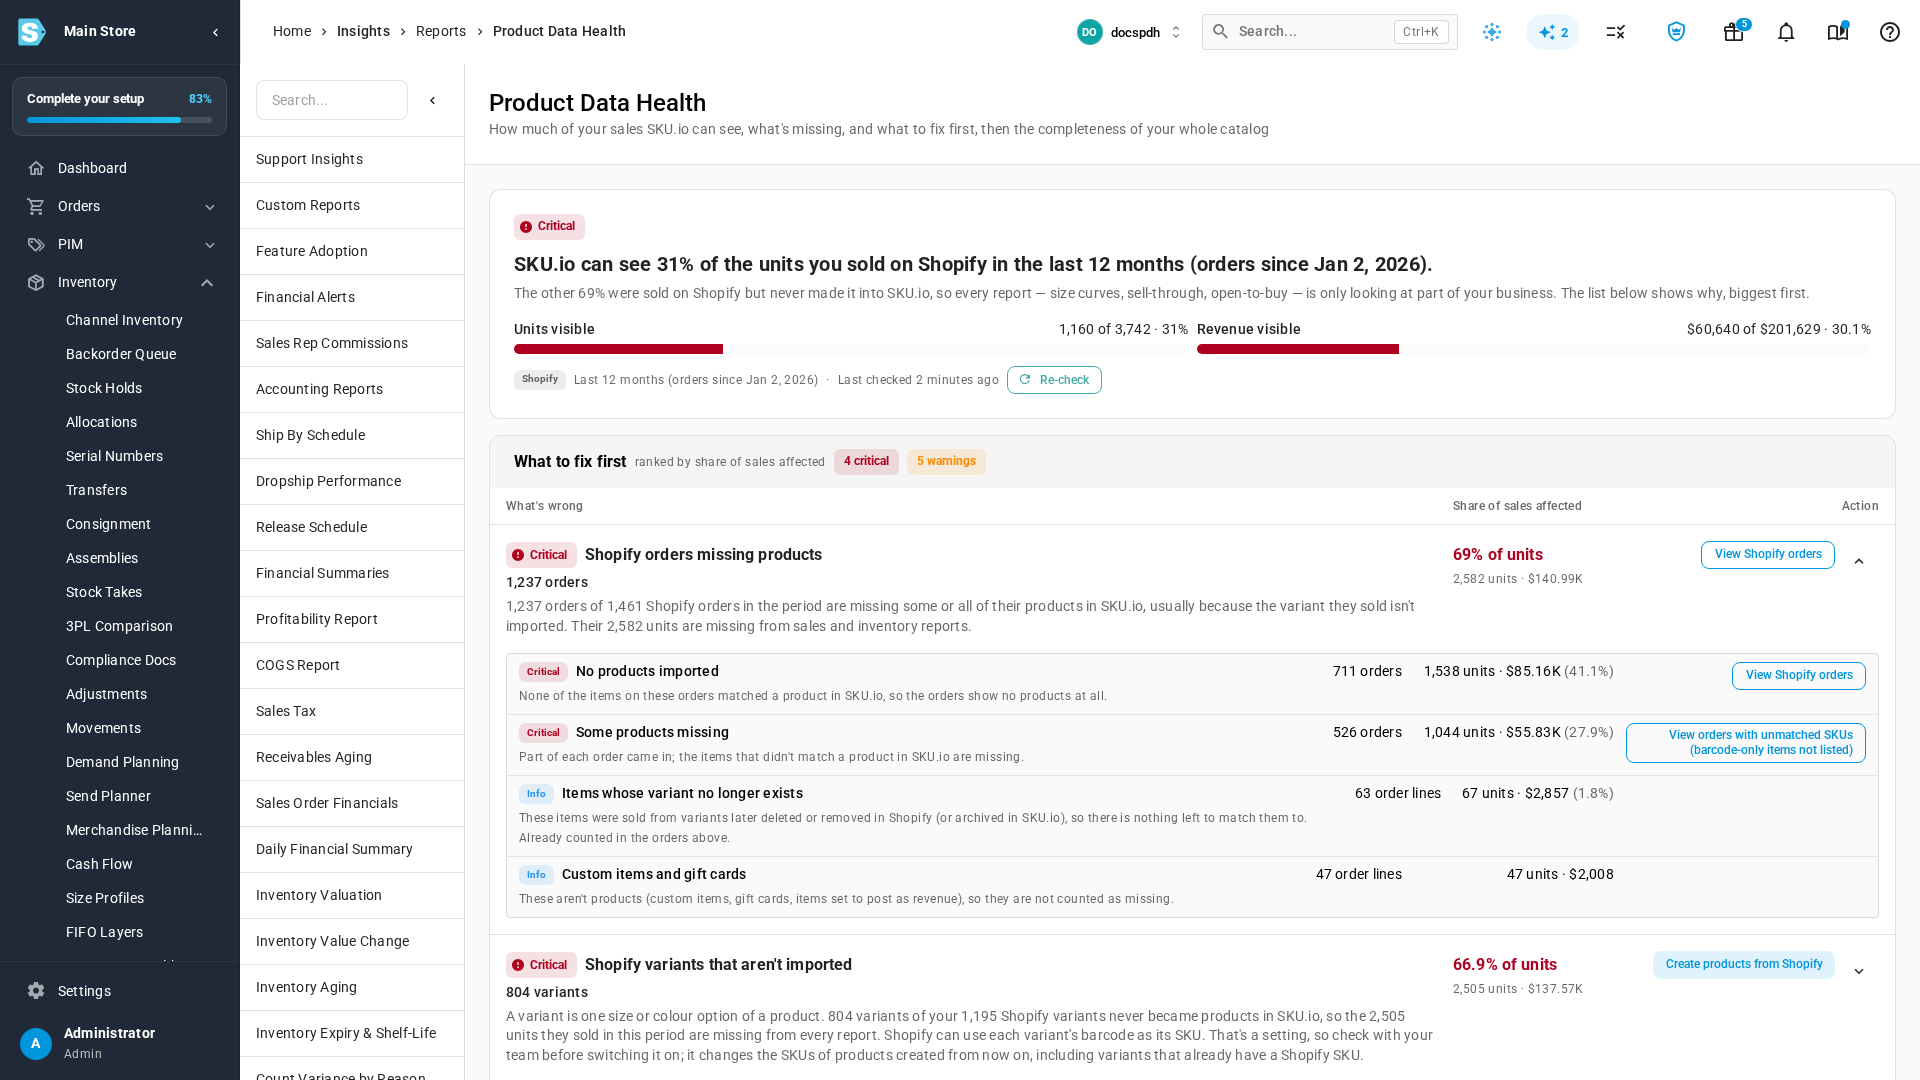
The card compares what your Shopify store sold over the last 12 months with what reached SKU.io. A chip above the headline rates the coverage, and the sentence under it says what share is missing and why that matters: size curves, sell-through and open-to-buy only look at the part of your business SKU.io can see.
| On the card | What it means |
|---|---|
| Units visible | Units sold on Shopify whose product is in SKU.io, out of every unit sold, with the share. |
| Revenue visible | The same comparison in revenue. |
| Period and Last checked | The window measured (last 12 months, or since your first order if that is later) and when the report was built. |
| Re-check | Builds the report again. The current figures stay on screen until the new ones are ready. |
The report is built in the background and kept for up to a day. It refreshes itself when it's more than 30 minutes old. While the very first build runs, the page says Checking your data… and fills in by itself when it's done. If a build fails, select Try again. Nothing in your account changes either way.
Work through "What to fix first"
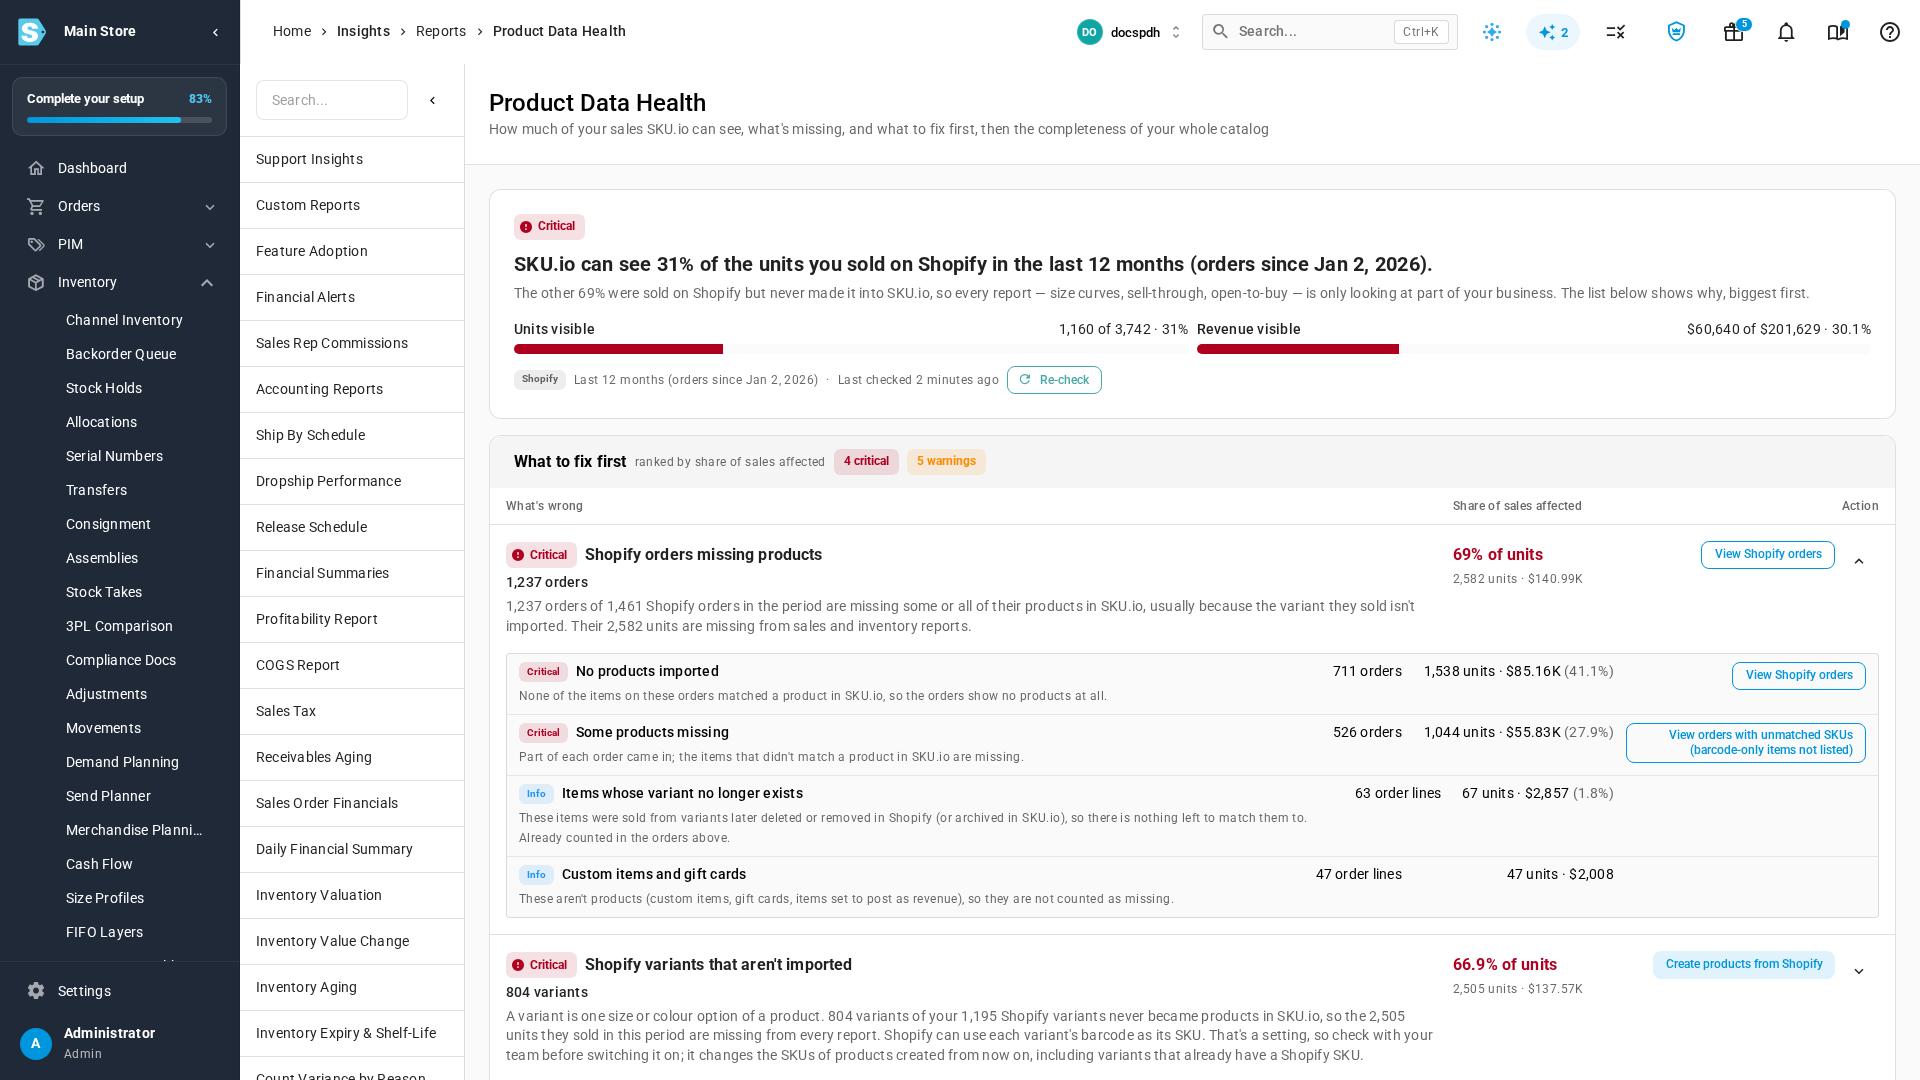
Every gap SKU.io checks is listed here, with the one hiding the largest share of sales first. The header counts how many are Critical and how many are warnings. Each row shows:
- What's wrong: the gap, how many items it covers, and a plain explanation of why it matters.
- Share of sales affected: the share of Shopify units sold on those items, with the units and revenue underneath.
- Action: a button that opens the fix. Select the arrow beside it to show the breakdown.
| Gap | What it means | Where the fix is |
|---|---|---|
| Shopify orders missing products | Orders where some or all of the items didn't match a product in SKU.io. The breakdown separates orders with no products at all from orders with some products missing. Items from variants later deleted in Shopify, custom items and gift cards are listed for information and aren't counted as missing. | View Shopify orders, filtered to the orders with unmatched items. |
| Shopify variants that aren't imported | Size or colour options that never became products in SKU.io, so their sales are missing from every report. The breakdown gives the reason (below). | Depends on the reason. |
| Products missing key attributes | Products sold without one or more of the details buyer reports slice by: gender, size, silhouette, fabric, print and season. Only the attributes you've set up are checked. | View products with no (attribute), the product list filtered to them. |
| Variants not grouped under a style | Products with a size or colour that aren't grouped under a style (a parent product), so style-level reports such as size curves can't add them up. | View ungrouped variants. |
| Products with no brand | Brand reports leave these products out. | Map Shopify vendors to brands, in your Shopify store's Content Sync settings. The product list stays one click away in the breakdown. |
| Products with no unit cost | Without a cost, SKU.io can't work out margin or return on inventory for them. | View products with no cost. If Shopify has their costs, fill Default Cost from Shopify in one go. |
| Products with no product type | Category reports group sales by product type, so these fall outside them. | View products with no type. |
| Size labels to review | Groups of size labels that probably mean the same size (such as "0-3 months" and "0-3M"), and labels SKU.io can't place in a size run (such as "Little Kid"). SKU.io never merges size labels for you. If two labels are the same size, use one of them on every product. | Review Size values, in your product attributes. |
| Shopify tags not used by any rule | Tags that no tag rule reads, so the information they carry (like "Girls" or "Organic cotton") never reaches your product fields. This gap doesn't hide sales. | Open tag rules, in your Shopify store's Content Sync settings. |
| History available | What history SKU.io holds today: months of orders, purchase receipts, your inventory start date and discount detail. Nothing is estimated. A report that needs more history says so. | Nothing to fix. |
A gap with nothing wrong shows OK and No sales affected. When everything checks out, a green Everything we check looks complete message replaces the warnings.
Variants that aren't imported, by reason
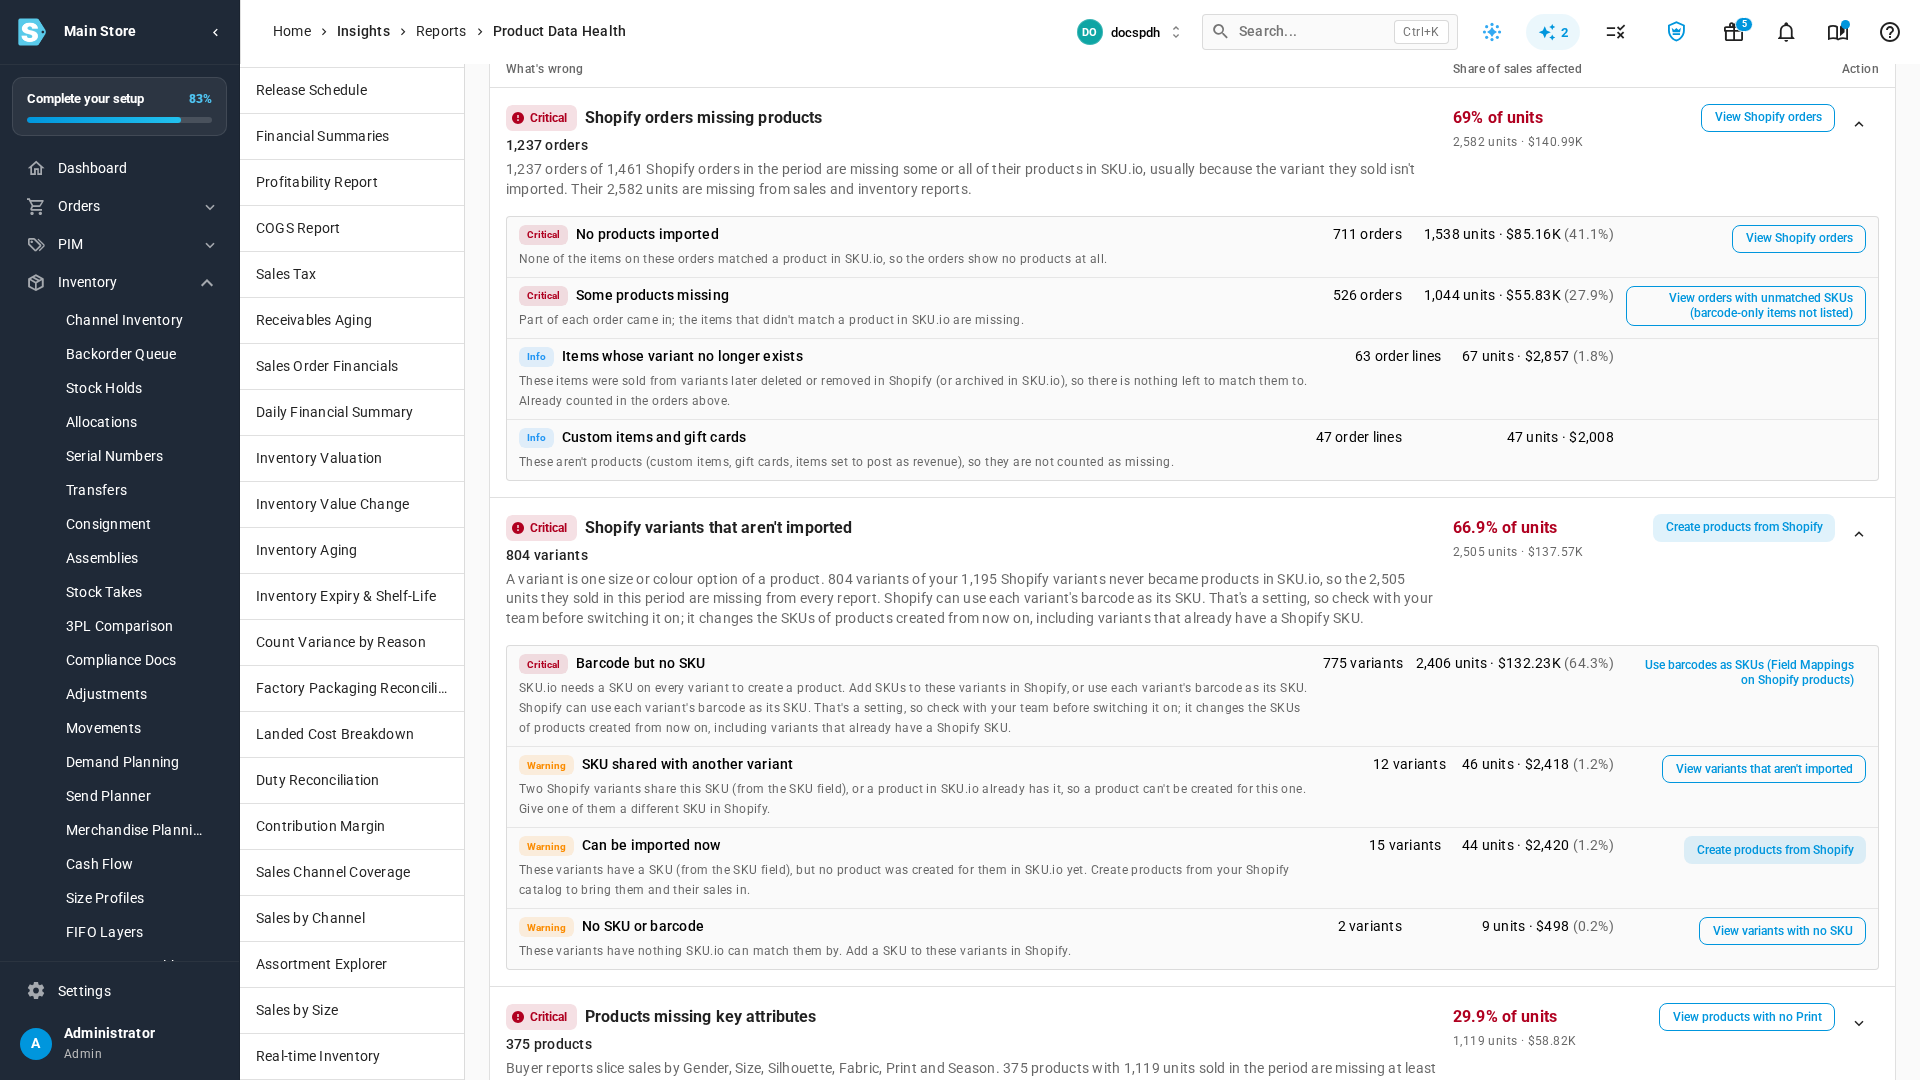
SKU.io needs a SKU on every variant to create a product from it. The breakdown splits the missing variants by why they weren't imported:
| Reason | What to do |
|---|---|
| Barcode but no SKU | Add SKUs to these variants in Shopify, or tell SKU.io to use each variant's barcode as its SKU. The action, Use barcodes as SKUs (Field Mappings on Shopify products), opens your Shopify products, where Field Mappings sets the source of the SKU field. Check with your team before you switch it on: it changes the SKUs of every product created from then on, including variants that already have a Shopify SKU. It never renames a product you already have. |
| SKU shared with another variant | Two Shopify variants share one SKU, or a product in SKU.io already has it, so a product can't be created for this one. Give one of them a different SKU in Shopify. |
| Can be imported now | These variants have a SKU but no product was created for them yet. Create products from Shopify brings them, and their sales, in. |
| No SKU or barcode | There's nothing to match them by. Add a SKU to these variants in Shopify. |
Other gaps
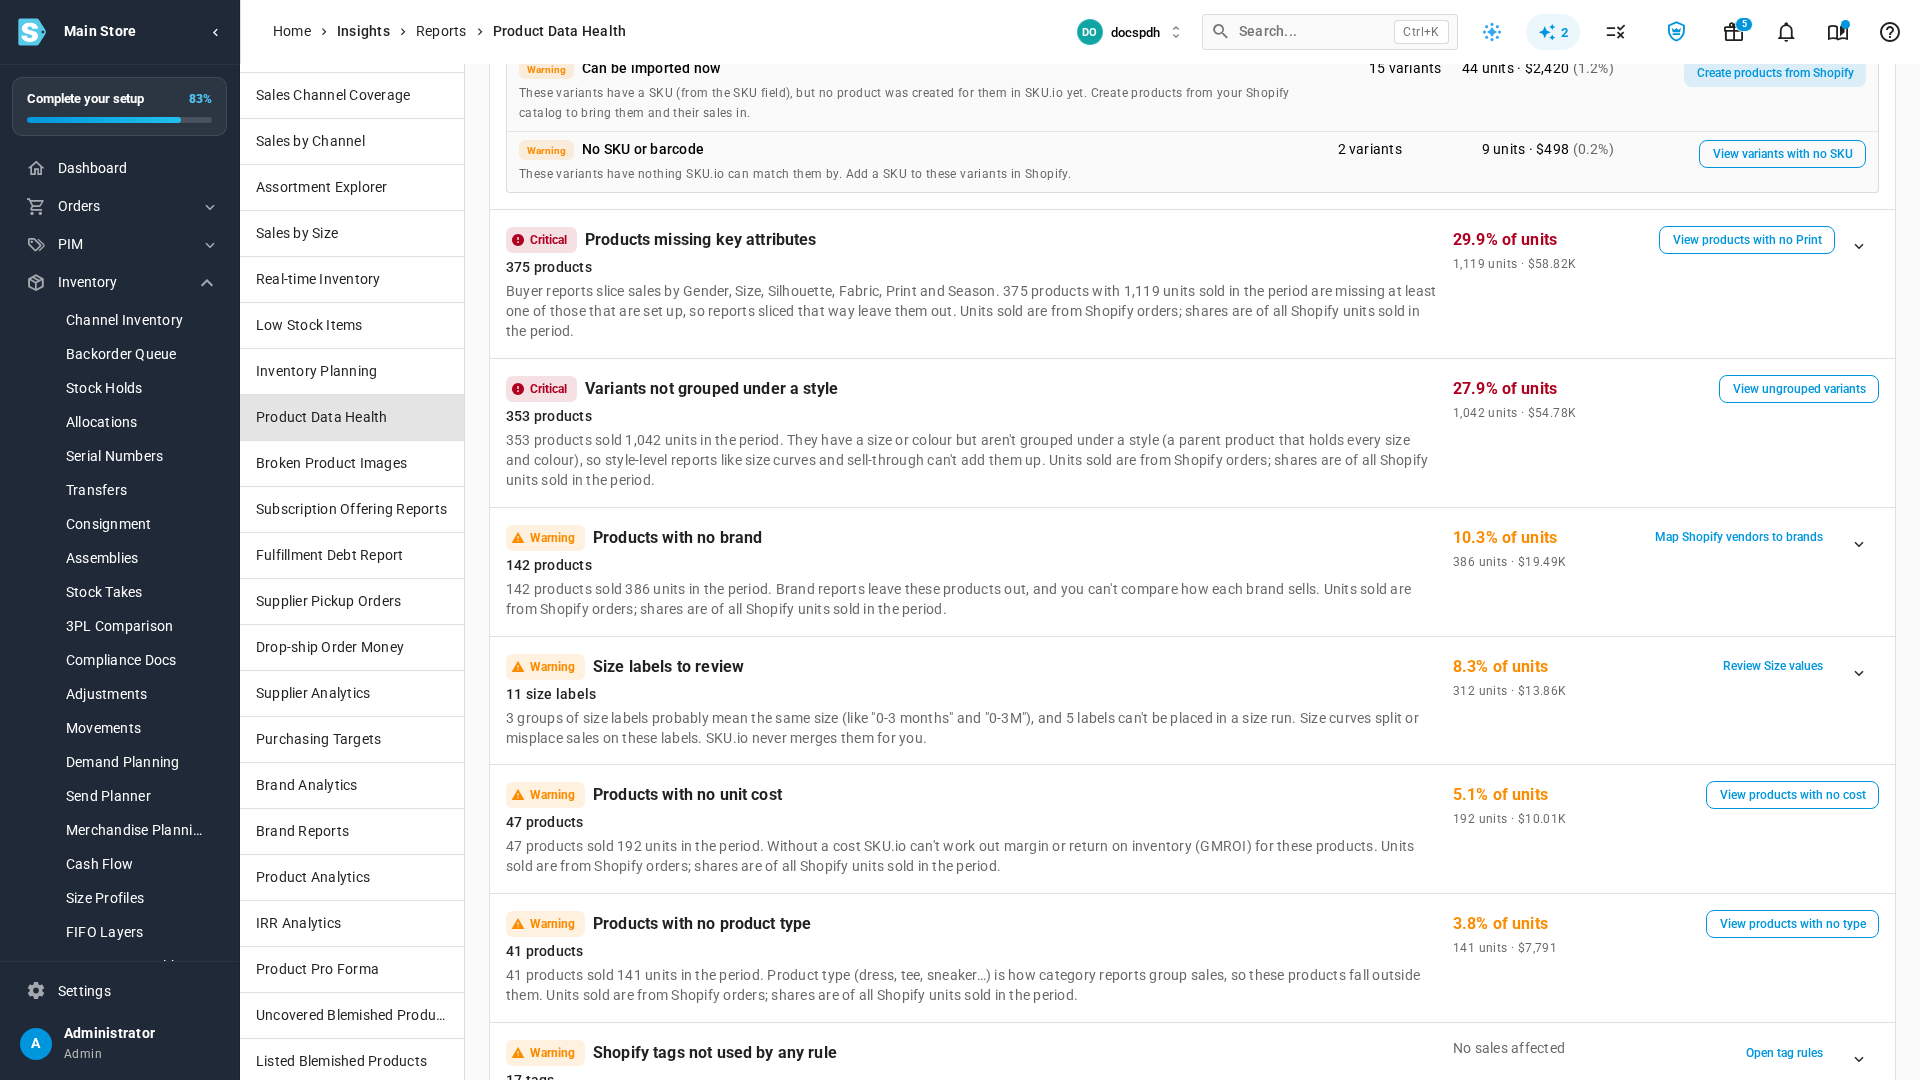
The brand, type and cost gaps count active products that sold in the period. The share of sales is the share of all Shopify units sold in the period, so a few best sellers can outweigh a long tail of products that rarely sell.
Review Catalog completeness
Below the gap list, Catalog completeness checks every product, whether or not it sold.
Buyer attribute health
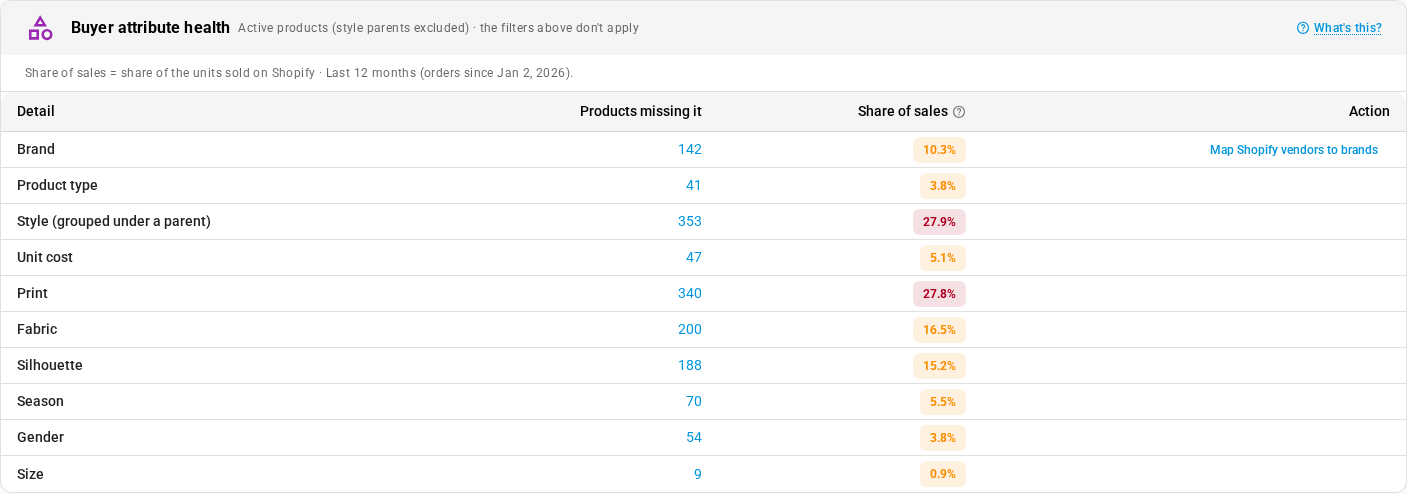
This card lists the details buyer reports group sales by: Brand, Product type, Style (grouped under a parent), Unit cost, and each of gender, size, silhouette, fabric, print and season that you've set up. For each one you see:
- Products missing it: select the count to open the product list filtered to exactly those products. A detail you haven't set up reads Not set up yet.
- Share of sales: the share of units sold in the period on products missing it.
- Action: a fix when it lives somewhere other than the product list, such as Map Shopify vendors to brands.
The card checks active products only, and leaves style parents out, so its counts can differ slightly from the cards further down. The Status, Brand and Supplier filters don't apply to it.
Filters and catalog cards
Three filters sit above the catalog cards. They apply to the cards below them, not to the coverage card, the gap list or Buyer attribute health.
| Filter | Values | What it does |
|---|---|---|
| Status | Active · Archived · All | Filters by archive state. The page opens on Active. |
| Brand | any brand | Limits the cards to products in that brand. |
| Supplier | any supplier | Matches only products whose default supplier is the chosen supplier. |
Use Reset Filters to return to the default view, and Refresh to recount the cards after you've fixed some products. Each count is a link that opens the matching products in the products list, already filtered.
Most cards split their headline number by product type (Standard, Kit, Bundle and the rest), so you can tell whether a gap is concentrated in one kind of product.
Product type distribution
Counts of Standard, Bundle, Kit, Matrix, Blemished, and Manufactured products, each with its share of the catalog. Active vs. archived is tracked per type. Click any type to see those products.
Default Cost Health
Splits products three ways by unit cost:
| Bucket | Meaning |
|---|---|
Has Default Cost (> $0) | A usable fallback cost is set. |
Zero Default Cost (= $0) | Cost was explicitly set to zero. |
| Missing Default Cost (null) | No cost has ever been entered. |
Default cost is only the fallback used to value inventory when there is no purchase/FIFO cost history (opening balances, stock takes, adjustments). See Set a product's accounting to fix it, and FIFO layers & COGS for where real cost comes from.
Purchase Cost Health
Counts the purchase order lines received at a unit cost of $0 that aren't marked free of charge, with the number of purchase orders they sit on and the products they cover. Lines on consignment orders aren't counted, and neither are lines nothing has been received against yet.
| Count | What it opens |
|---|---|
| Lines received at $0 (not free of charge) | The purchase order list, filtered on Has $0 Lines? |
| Purchase orders with $0 lines | The same filtered list |
| Products affected | — |
A line saved at $0 puts its units into stock at $0. Every sale, build or transfer that uses those units then carries little or no cost of goods, including stock sent to Amazon FBA, which takes the average cost of what it was transferred from. Profit on those sales looks higher than it is. Most of the time the cost was never entered; open each order and correct the line's cost. If a line really was free (a sample, a replacement, a supplier credit), mark it free of charge instead and it drops out of the count.
Brand Health
Has Brand vs. Missing Brand, plus a distribution of products per brand. Fix gaps in Edit a product's details; manage the list in Manage brands.
Supplier Health
Has Supplier vs. Missing Supplier, broken out for Standard and Kit products. Bundles are excluded from the supplier population — they're virtual groupings with no inventory and never carry a supplier. A separate Supplier Count Distribution chart shows how many products have 0, 1, 2, or 3+ suppliers. Fix gaps in Manage a product's suppliers.
Supplier Price Health
Among only the products that have a default supplier, this compares Valid Supplier Price (> 0) against Zero / Missing Supplier Price. The "zero/missing" count is the default-supplier population minus those with a valid price, so products with no default supplier are never counted here.
Kit/Bundle Component Health
Kits without Components and Bundles without Components — parents that have been typed as a kit or bundle but never had components attached. Both should read None. Build them in the Workshop.
Kits with only one component and Bundles with only one component — kits and bundles made of exactly one unit of one product. Such a kit is the same thing as that product, so whatever it should also hold (usually the box or packaging) never depletes, never reaches its reorder point, and never shows in a forecast. A multi-pack (2 or more units of one product) isn't counted. A count greater than zero shows in amber. Hover over the info icon beside the label for the rule. Select the count to open Products filtered to those kits or bundles, using the Component Units (total qty) filter set to 1. Add the missing component in the Workshop, or leave it if the kit is meant to be a single item. This is a warning, not an error.
Pricing Health
Has Pricing (at least one pricing-tier price > 0) vs. Missing Pricing. Like the supplier metrics, bundles are excluded from this population — a bundle is priced from its components, so counting every bundle as "without pricing" would be misleading. This keeps the pricing cards consistent with the supplier cards. Set prices in Set a product's price.
Sales Channel Mapping
For each connected channel (Shopify, Amazon, BigCommerce, Walmart, WooCommerce, eBay), this shows how many channel listings are Mapped to a SKU.io product versus Unmapped, grouped per integration instance. See what mapping resolves below. Clicking a channel or a count opens that channel's mapping page — actual listing and publishing lives in the Listings guide, not here.
Image Health
- Products with Image / Products Missing Image — whether any image is attached.
- Products with Broken Image — products whose primary image failed the last validation check (a dead remote URL or a missing local file). Until a check has run this reads Not checked and isn't clickable.
The panel shows Last checked (or Never checked). Click Check Image Health to re-validate every image — local files are checked on disk, remote URLs over HTTP. That runs as a background tracked job; watch its progress in the job tray, and the dashboard refreshes when it finishes. The broken-image count links to the dedicated report, where each image reloads live in your browser (false positives clear themselves) and genuinely dead images can be bulk-removed — see Find & fix broken product images.
How channel mapping is counted
A channel listing counts as mapped only when the whole chain resolves: the channel's own product record is linked to a channel product in SKU.io, and the listing built on it points at a real SKU.io product. Break the chain anywhere and the listing counts as unmapped.
Two edge cases shape the numbers:
- Archived channel products are excluded — only live listings are counted.
- Channels you haven't connected are skipped entirely. If an integration isn't set up, that channel doesn't appear in the breakdown at all — which is not the same as showing "0 mapped".
This is the health snapshot only. To actually map, publish, or edit listings, use the channel's own mapping page (linked from each channel row) — full listing workflows are covered in the Listings guide. For how catalog data flows into channels and reporting, see Products, channels & reporting.
Why each gap matters
The dashboard exists because incomplete product data silently breaks downstream operations:
| Gap | Downstream effect |
|---|---|
| Missing supplier | The product is excluded from demand forecasting and automated purchasing — it never generates a purchase suggestion, so it quietly stocks out. |
| Zero / null unit cost | Inventory with no cost history is valued at $0, producing wrong COGS and inflated margins in reporting. |
| Purchase lines received at $0 | Units enter stock at $0, so the sales that use them, Amazon FBA sales included, show almost no cost of goods and profit is overstated. |
| Kit / bundle without components | The parent can't be assembled or fulfilled — orders for it fail at processing time. |
| Kit / bundle with only one component | The kit passes straight through to its one product, so packaging or other parts left out never deplete, reorder or forecast. |
| Missing pricing | The product can't be listed at an accurate price on a sales channel. |
| Unmapped channel listing | Inventory levels don't sync to that listing, so it can oversell. |
Clear the red counts and those failure modes disappear.
Where else coverage shows up
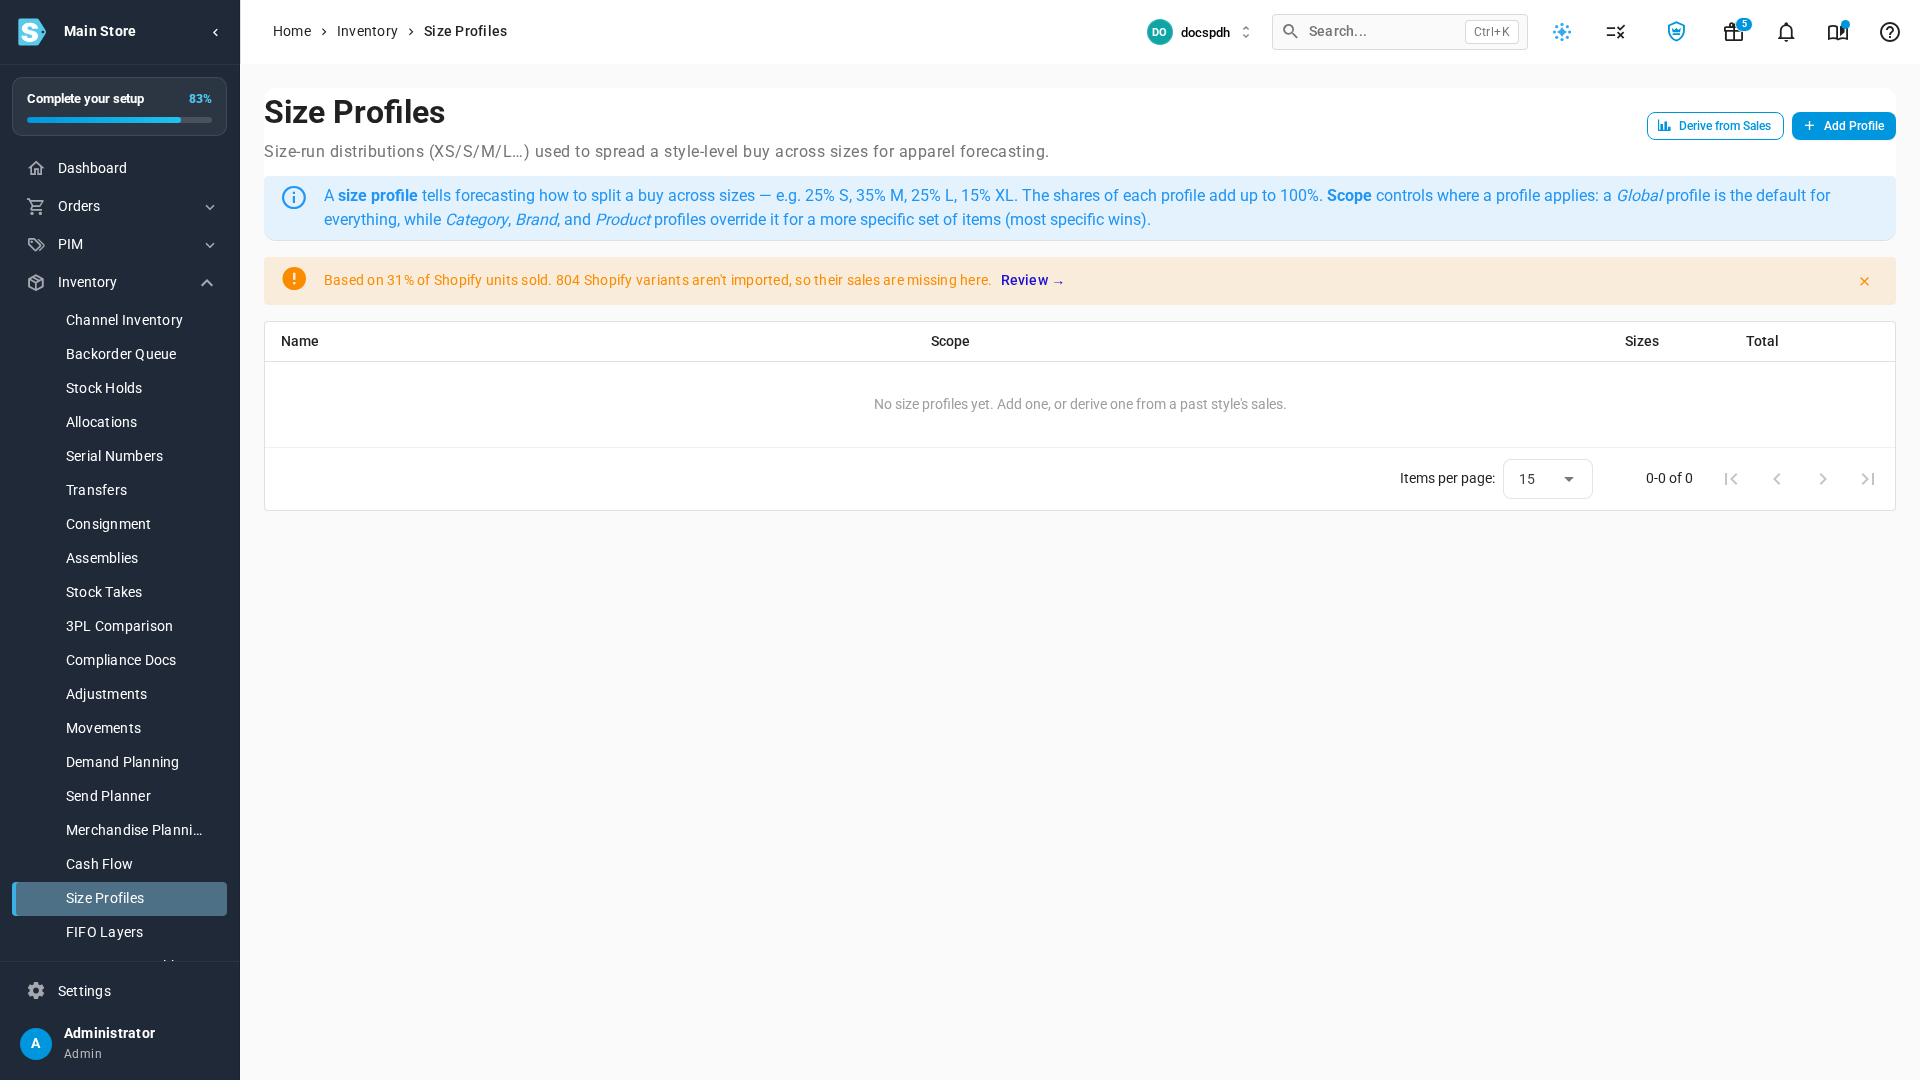
- Coverage banner. While SKU.io sees less than 95% of your Shopify units, Sales by Size, Size Profiles, Merchandise Planning, Product Analytics and Brand Analytics show a banner such as "Based on 31% of Shopify units sold." Select Review to open Product Data Health. Closing the banner hides it for the rest of your session, unless the figure changes.
- Sales coverage dashboard widget. Add Sales coverage to your dashboard to see the share of units SKU.io can see and the two gaps hiding the most sales. It's different from the Catalog data health widget, which counts incomplete products.
- Getting started. The Check your data step of your setup checklist (open it from Complete your setup in the sidebar) is complete once SKU.io sees at least 95% of the units sold on Shopify, or once your store has no sales yet.
Next steps
- Browse, search & filter the products list, where every product count lands.
- Find & fix broken product images
- Manage a product's suppliers · Set a product's price · Manage brands
- Products, channels & reporting
Video transcript
When a report sees only part of your sales, a banner says so. Here, Size Profiles is based on 31% of the units sold on Shopify. Select Review to see what's missing, and why. Selecting Review opens Product Data Health, the report behind that banner. The page starts with your sales coverage. It compares what Shopify sold in the last twelve months with what reached SKU.io. One bar shows units, the other shows revenue. After you fix something, select Re-check. On a large catalog, the check takes a few minutes. What to fix first lists every gap, biggest share of sales first. Each one shows how many items it covers, the units and revenue involved, and what went wrong. Chips in the header count the critical gaps and the warnings. To see why a gap exists, open its breakdown with the arrow beside its action button. Variants that aren't imported are split by reason. In this store, the biggest is Barcode but no SKU. Its fix is a Field Mappings option that uses barcodes as SKUs. Talk to your team first: turning it on affects how every new product is identified. Further down are products with no brand, type or cost, and products missing key attributes. Size labels that probably mean the same size are flagged. Merging them stays your decision. Each action opens its fix, such as mapping Shopify vendors to brands. Under Catalog completeness, Buyer attribute health lists the details buyer reports need. Each row counts the products missing it, and shows their share of all units sold. Select a number to open exactly those items. Every count on this page works the same way, including the cards further down. Here, the filter is already applied: everything with no brand, ready to fix.