Build a custom report
When none of the ready-made reports answers your question, build your own in Custom Reports. You pick what the report is about, such as sales order lines or purchase orders, then add fields from that record and the records linked to it: its order, product, brand, customer, warehouse, or sales channel. Lay the fields out as a flat table or as a pivot with rows, columns, and totals, then save it to run again whenever you need the numbers.
If you'd rather describe the report in a sentence, see Build a report by describing it. It sets up the same controls described here, so you can check and adjust its work.
Before you begin
- You need access to Custom Reports. An administrator grants it under your role's report permissions.
- Custom reports read your data. They never change a record.
Open the report builder
-
Go to Insights → Reports and open Custom Reports.
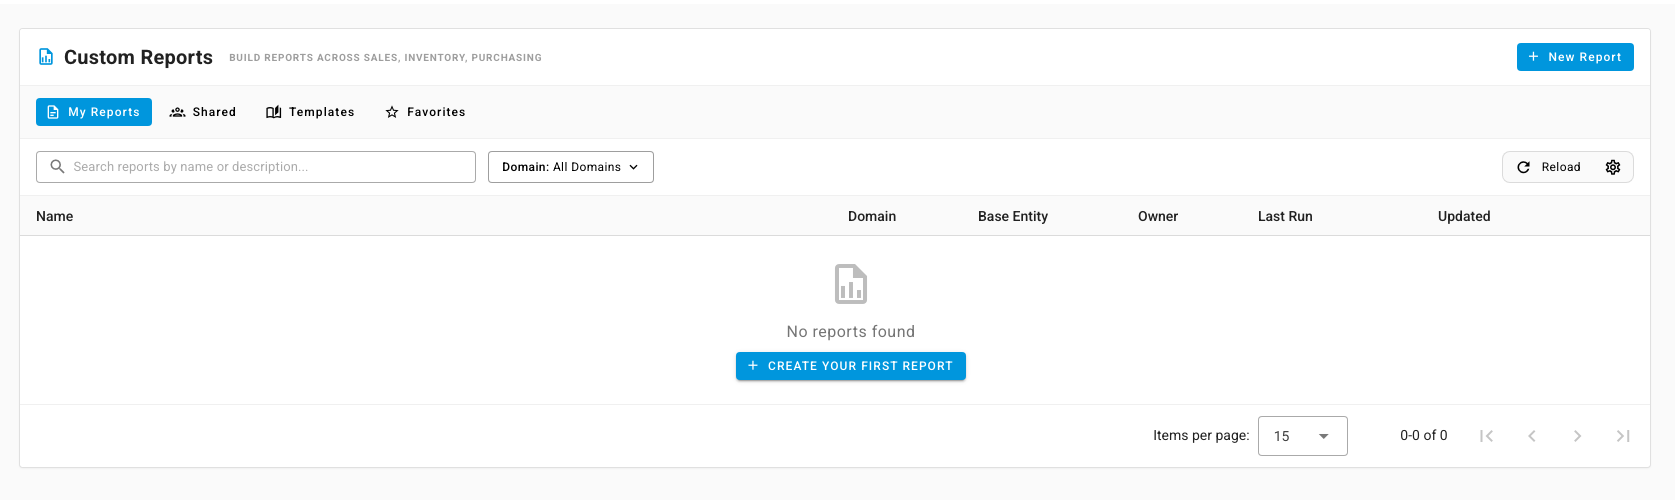
The list has four tabs: My Reports, Shared, Templates, and Favorites. Search by name or narrow the list with the Domain filter.
-
Click New Report.
A short tour runs the first time. Click Next to follow it, or Skip to close it. You can replay it later with Tour.
Choose the data
-
Under Data Source, pick a Domain: Sales, Inventory, Purchasing, Financial, Returns, or Logistics.
-
Pick a Base Entity, the record each row is built from. For sales by product or brand, Sales Order Lines is a good choice.
The Fields list fills with every field you can use, grouped by the record it belongs to. Press / to jump to the field search.
Lay out the report
You can build a report in two ways.
- A flat table. Click a field in the Fields list to add it as a column. A tick shows which fields are in use. Click Run Report to see one row per value, with a Totals line for numeric columns.
- A pivot. Drag fields onto the shelves above the results:
- Rows: what each row stands for, such as Brand Name.
- Columns: what to spread across the top, such as Order Status.
- Values: the number to total, such as Gross Revenue. The chip shows how it's totalled, for example SUM. Click the chip to change it.
- Filters: a field to filter on.
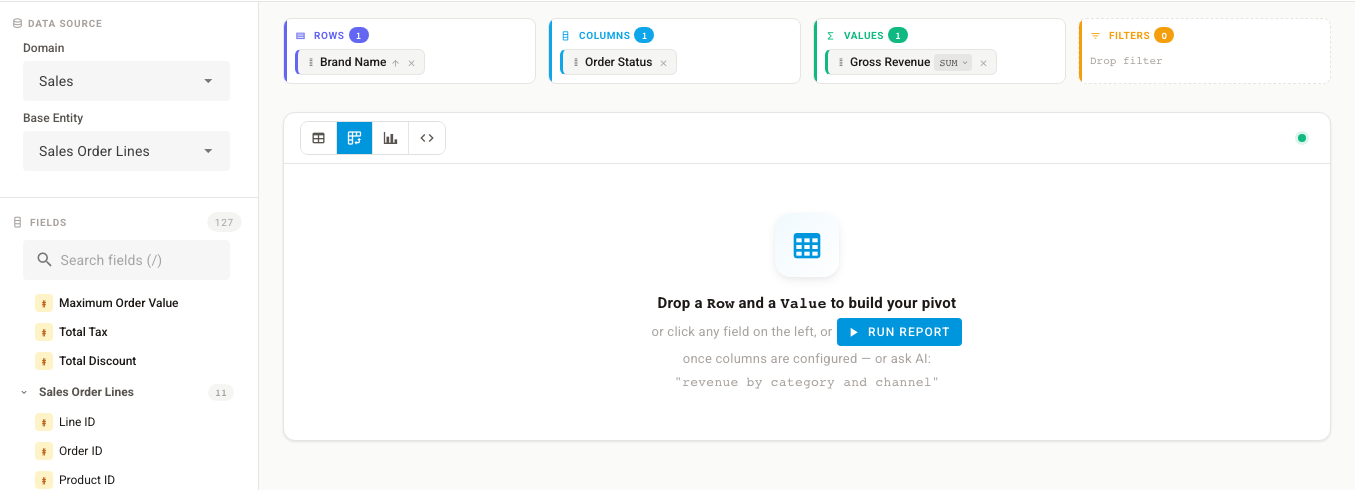
Click Run Report. The results show the row count and how long the report took to run.
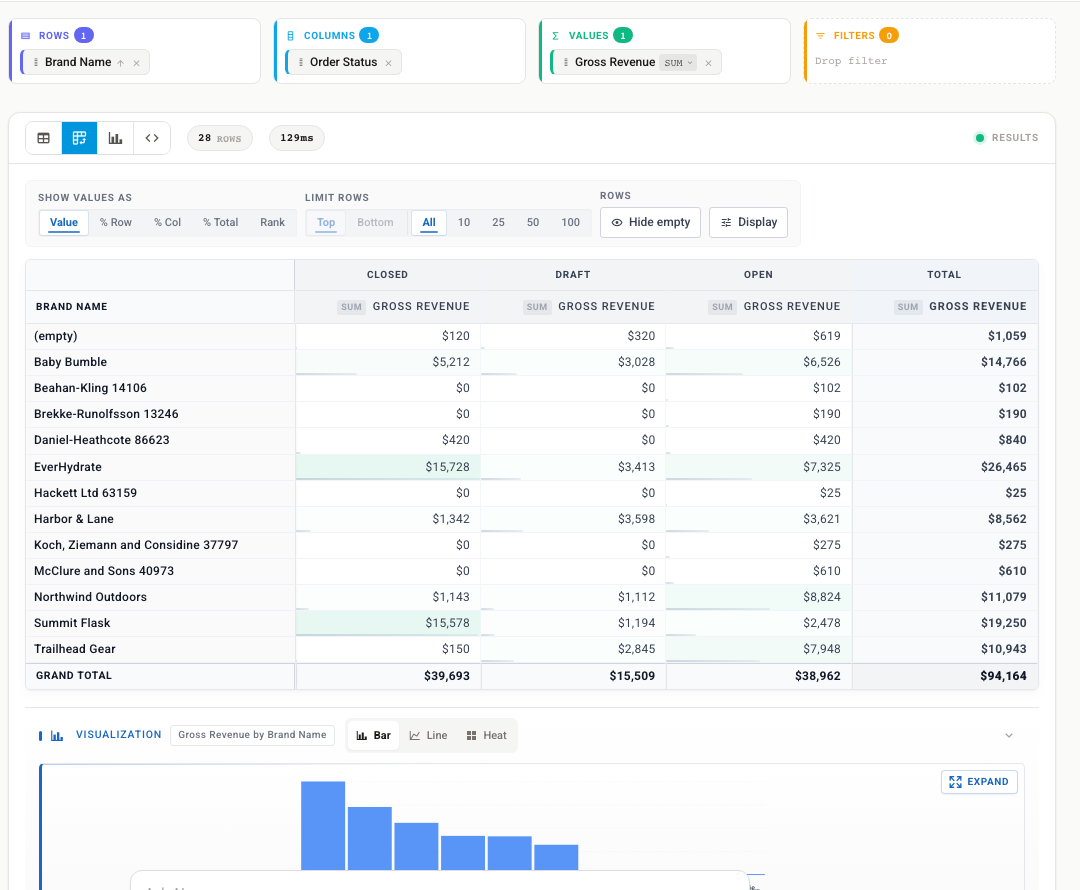
Above a pivot you can change how the numbers read:
- Show values as: Value, % Row, % Col, % Total, or Rank.
- Limit rows: show only the Top or Bottom 10, 25, 50, or 100.
- Hide empty drops rows with nothing in them.
The Visualization strip under the pivot charts the same numbers as Bar, Line, or Heat. Click Expand for a larger chart.
The icons at the top left of the results switch between the table, the pivot, the chart, and the generated SQL query.
Filter, sort, and format
The Config tab on the right holds the rest of the report's settings.
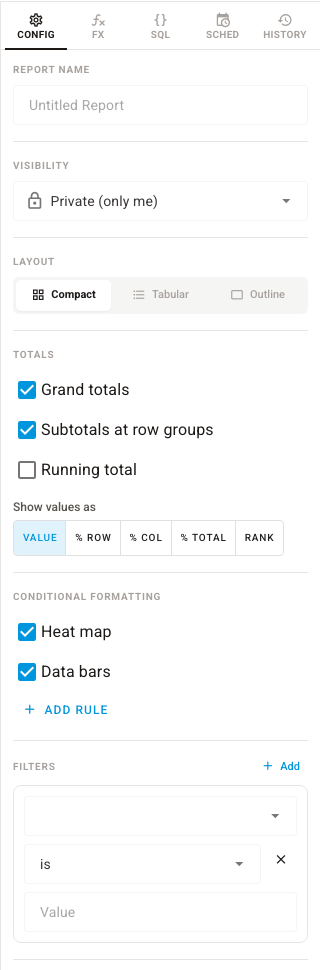
- Filters: click Add, choose a field, an operator such as is, contains, or is one of, and a value.
- Sort: click Add to order the rows by any field.
- Limit: the most rows the report returns. The default is 500.
- Layout: Compact, Tabular, or Outline for a pivot.
- Totals: turn Grand totals, Subtotals at row groups, and Running total on or off.
- Conditional formatting: Heat map and Data bars shade the values. Click Add rule to color cells that meet a condition.
The Fx tab adds a calculated column from a formula, such as revenue per unit.
Drill into a value
Click a value in a row of the results. The Drill Down panel opens with the records behind that number.
Save and reuse the report
-
Under Report Name, enter a name, such as Gross revenue by brand and order status.
-
Click Save.
A saved badge appears next to the name. After later changes, click Save Changes. The History tab lists every saved version, and you can restore an earlier one.
-
To download the results, click Export and choose CSV, XLSX, or PDF.
The report now appears under My Reports. Click the star on a report to add it to Favorites, or use Duplicate to start a new report from a copy.
Press ⌘K (or click Commands) to run, save, export, switch views, share, schedule, or duplicate the report without leaving the keyboard. Press R to run the report and ⌘S to save it.
Next steps
- Share a custom report and email it on a schedule: give colleagues the report, or have it arrive by email.
- Build a report by describing it: let Report Builder AI set up the report for you.
- Reports catalog: check whether a ready-made report already answers the question.