Write a report in SQL
The report builder answers most questions in a few clicks. When you need something it can't express, such as a ranking, a share of the total, or two periods side by side, write the report as an SQL query instead. The query only reads your data, and once you save it, it's a custom report like any other: you can share it, schedule it, and export it.
This guide is for people who already write SQL. If you don't, try Build a report by describing it first.
Before you begin
- You're an administrator, or your role has the Write SQL permission under Reports. Full Access doesn't include it, so an administrator has to tick it for your role in Settings → Roles.
- You need access to Custom Reports, the same as for any custom report.
- SQL reports can't change your data. They run a single
SELECTstatement, and they can only read the tables listed in the Schema panel.
Steps
-
Go to Insights → Reports → Custom.
-
Click New SQL Report.

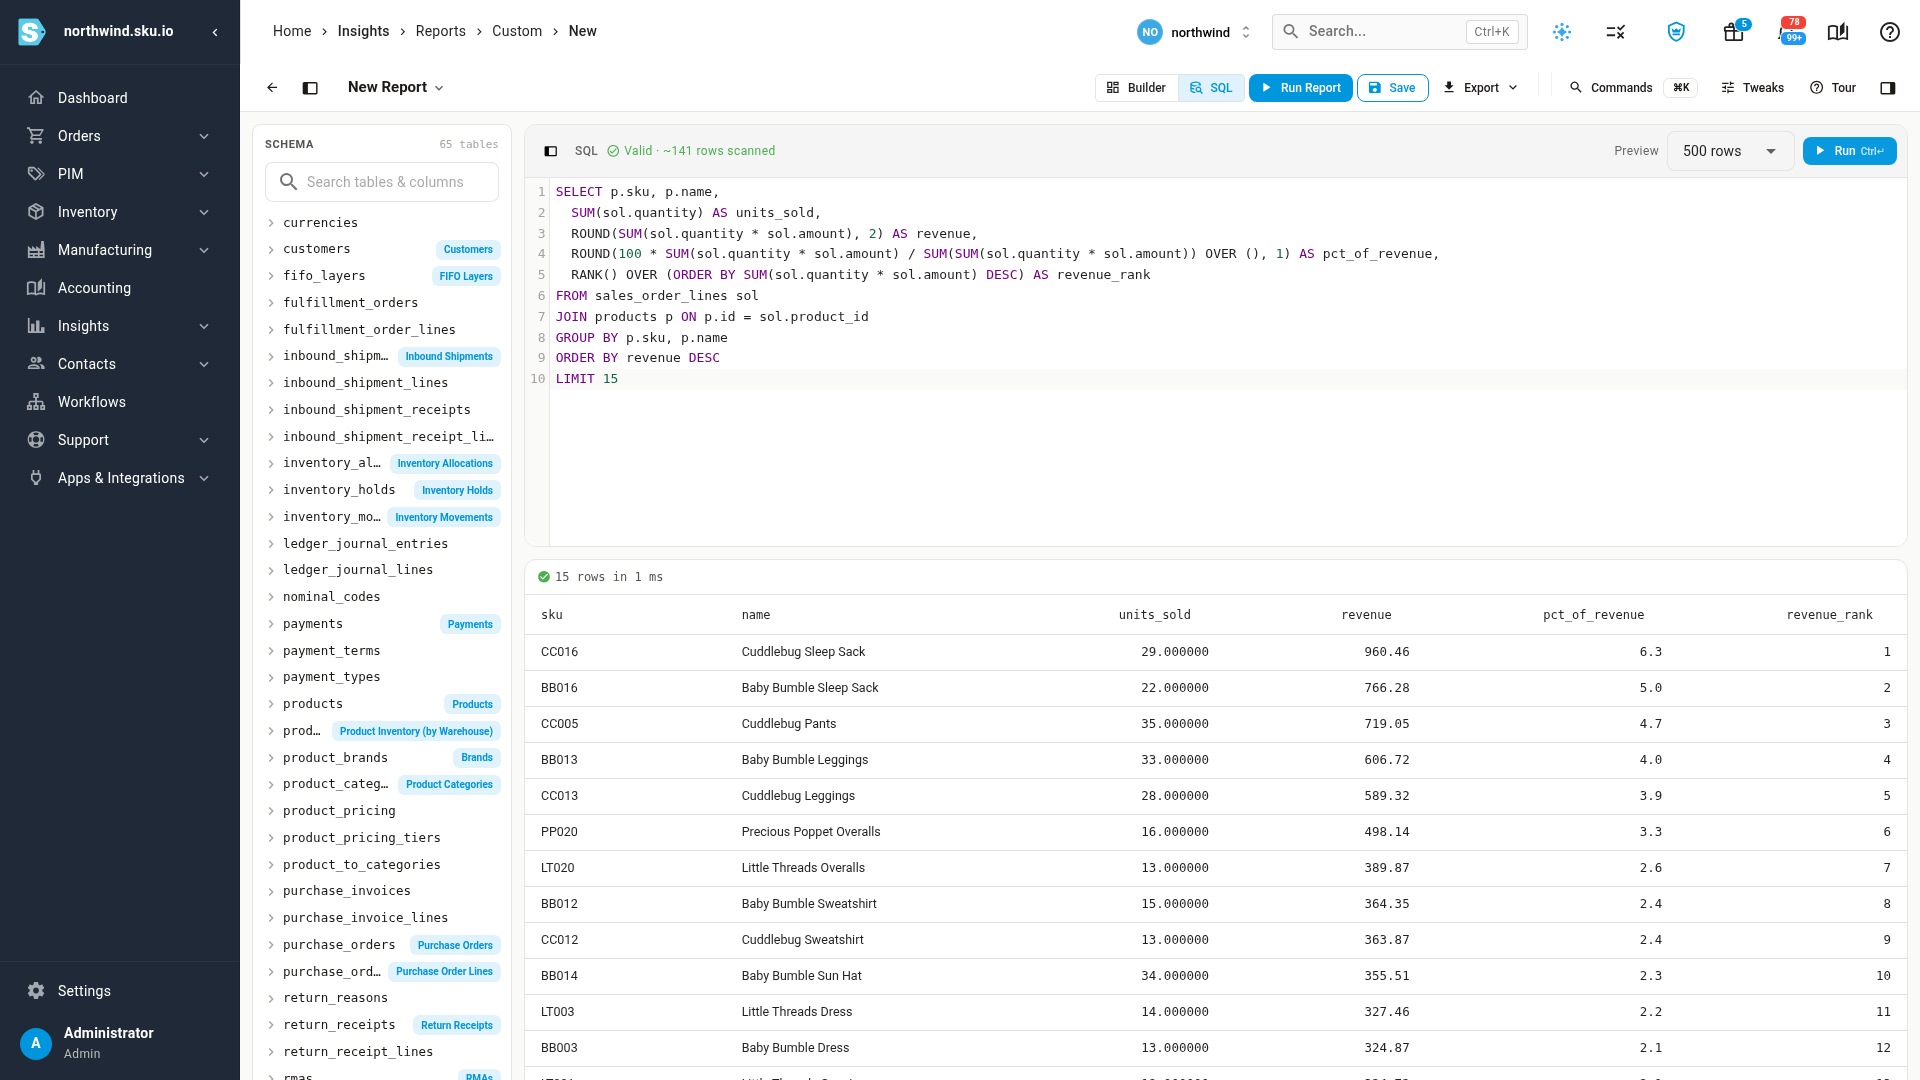
The SQL workspace opens. The Schema panel on the left lists every table you can query, the editor is in the middle, and the results appear underneath. Until you type, the editor shows an example query in grey.
-
Find the tables and columns you need in the Schema panel. Type in Search tables & columns to filter the list, and click the arrow next to a table to see its columns and their types. Click a table or column name to insert it into the editor at the cursor.
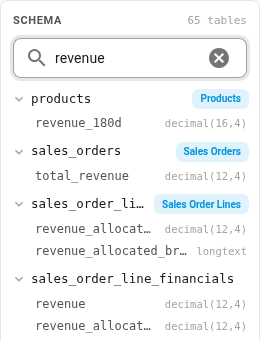
A blue tag next to a table, such as Sales Orders, shows which area of SKU.io it holds.
-
Write your query in the editor. As you type, it suggests table and column names.
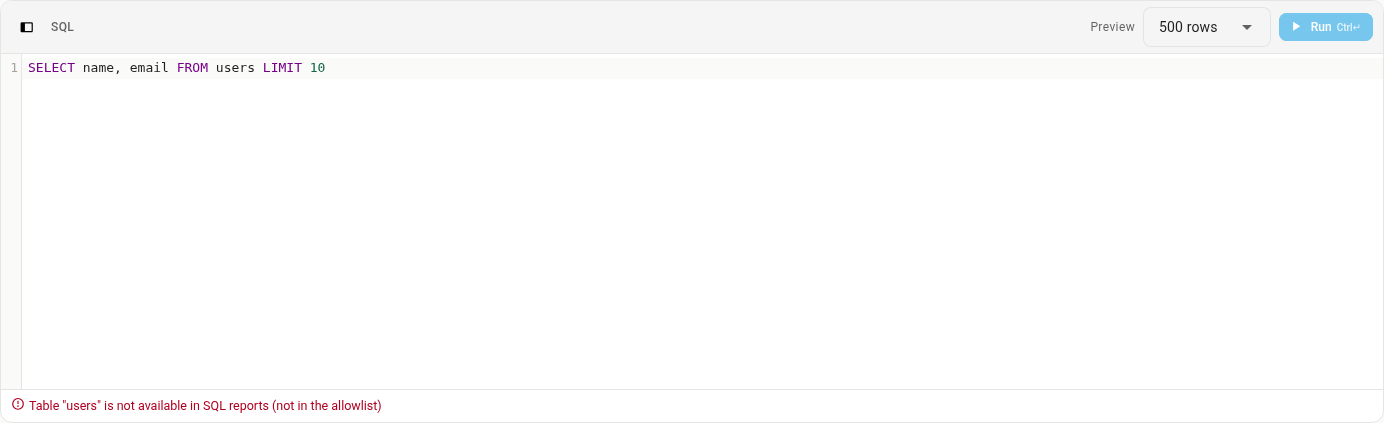
SKU.io checks the query while you type. When it's ready to run, a green Valid tick appears above the editor with a rough count of the rows it expects to scan. If something is wrong, the problem appears in red under the editor and you can't click Run until you fix it. See What SQL reports can't do.

-
Choose how many rows to preview in Preview: 10, 100, 500, 1,000, or 5,000. This limits only the preview. Exports include more rows.
-
Click Run, or press Ctrl+Enter (⌘+Enter on a Mac).
The results grid shows each row and a line such as 15 rows in 1 ms. If any column holds a date and time, a Times shown in UTC tag appears, because SQL reports show times as they're stored rather than in your time zone.
-
Click Save, enter a Report Name, and click Save again.

The report is saved to My Reports. On the Custom Reports list it carries a teal SQL badge. To list only SQL reports, set the Domain filter to SQL.
You can also turn an open report into an SQL report with the Builder / SQL switch at the top right of the report. The builder can't show a query, so if you switch an SQL report back to Builder and save it, it becomes a builder report. The SQL version stays in the report's History.
An example query
This query ranks products by revenue and shows each product's share of the total. It's the query in the screenshot in step 6.
SELECT p.sku, p.name,
  SUM(sol.quantity) AS units_sold,
  ROUND(SUM(sol.quantity * sol.amount), 2) AS revenue,
  ROUND(100 * SUM(sol.quantity * sol.amount) / SUM(SUM(sol.quantity * sol.amount)) OVER (), 1) AS pct_of_revenue,
  RANK() OVER (ORDER BY SUM(sol.quantity * sol.amount) DESC) AS revenue_rank
FROM sales_order_lines sol
JOIN products p ON p.id = sol.product_id
GROUP BY p.sku, p.name
ORDER BY revenue DESC
LIMIT 15
Name your result columns with AS, because the names become the column headers
in the results and in exports. Ranking functions like RANK(), running totals,
and WITH clauses all work.
Share, schedule, and export it
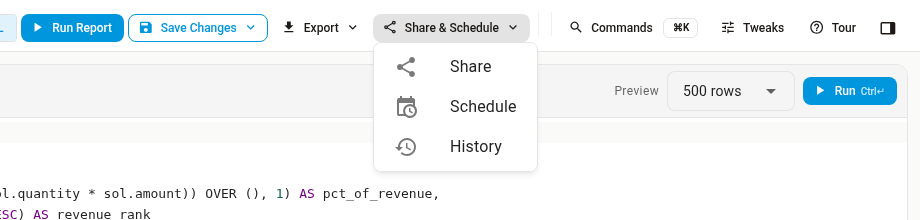
Once the report is saved, the toolbar shows Export and Share & Schedule.
- Export downloads the results as Export CSV, Export XLSX, or Export PDF. A CSV export can hold up to 100,000 rows, and an XLSX or PDF export up to 10,000.
- Share & Schedule opens Share, Schedule, or History. They work as they do for any custom report. See Share a custom report and email it on a schedule.
A teammate you share an SQL report with can run it and see the query. Only people who can write SQL can change it.
What SQL reports can't do
SQL reports can only read your data. SKU.io checks every query before it runs, and explains anything it won't run under the editor. These are the messages you're most likely to see:
| Message under the editor | What to do |
|---|---|
| Only SELECT statements are allowed | Write a single SELECT query. Statements that change data, such as an update or a delete, never run. |
| Table "users" is not available in SQL reports (not in the allowlist) | Query only the tables listed in the Schema panel. |
SELECT * is not available on "purchase_orders" in SQL reports — list the columns you need instead | Some tables hold a few private columns, so name the columns you want instead of using *. |
| Only a single statement is allowed | Run one query at a time. |
Messages in orange are only advice, and you can still run the query. For example, No LIMIT clause — the preview is capped at the server-side row limit reminds you that the preview stops at the number of rows you chose in Preview.
A few more limits keep SQL reports from slowing down the rest of SKU.io:
- Previews have a 30-second time limit. A preview that runs longer is stopped,
and you see The query didn't run. Narrow it with a
WHEREclause or a lowerLIMIT, or export it instead, because exports get up to five minutes. - Very large queries run in the background. If SKU.io expects a query to scan more than about 500,000 rows, SKU.io doesn't run it on screen. You see Running in the background instead, and the CSV is ready to download from the job tray when it finishes.
- Every run is recorded. SKU.io logs who ran each SQL query, when, how long it took, and how many rows it returned.
Next steps
- Build a custom report: build a report by picking fields instead of writing SQL.
- Share a custom report and email it on a schedule: share an SQL report or have it emailed on a schedule.
- Get your SKU.io data into a spreadsheet or BI tool: other ways to take your data out of SKU.io.