Read the returns dashboard
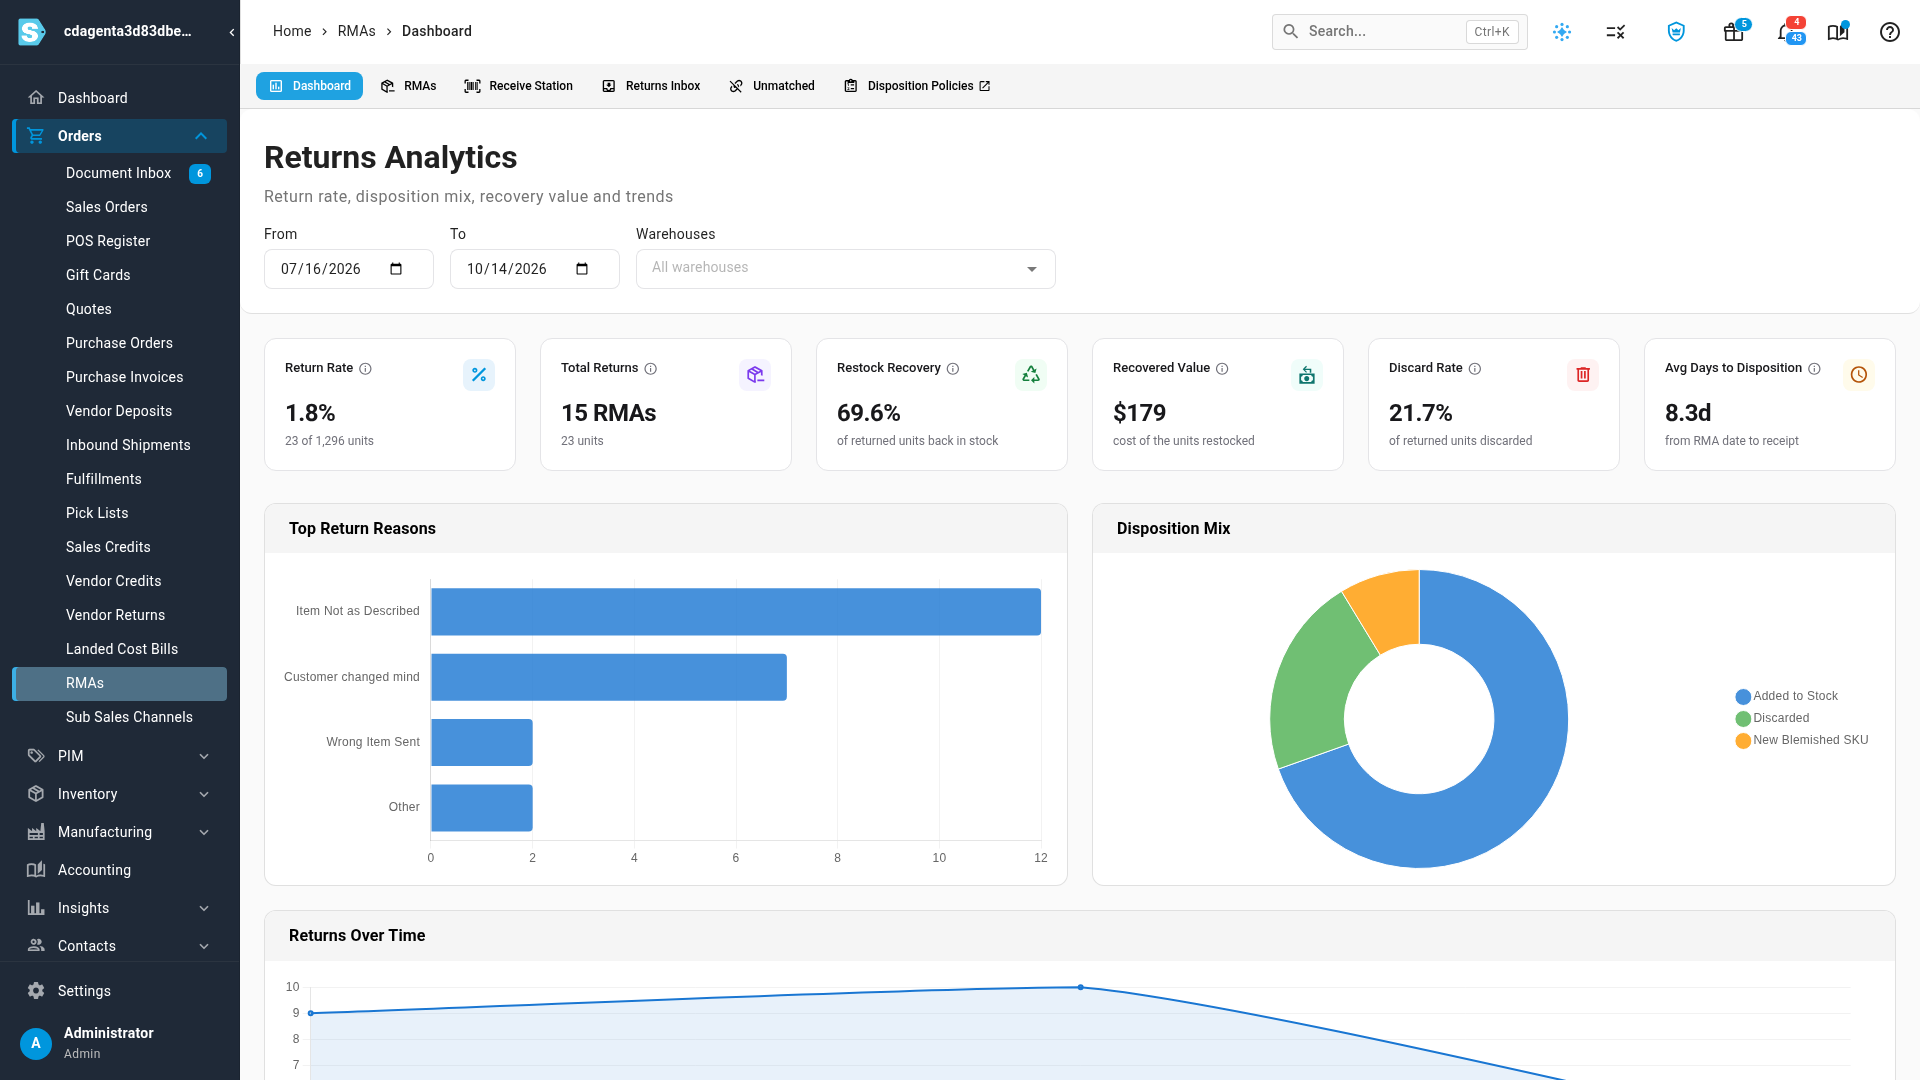
Returns Analytics is the first thing you see when you open Orders → RMAs. It answers the questions a returns manager asks every week: how much comes back, how much of it you can sell again, what it's worth, and why customers return things. Every number is built from the returns you have received, so it reflects goods that physically came back, not returns that are only authorized.
Before you begin
- The dashboard fills in as you receive returns, either on an RMA or at the Receive Station. See Process a customer return and Receive returns at the Receive Station.
- The Disposition Mix depends on what you chose when you received each unit. To default those choices, see Set up return disposition policies.
Read the dashboard
-
Go to Orders → RMAs. The returns area opens on its Dashboard tab, titled Returns Analytics.
-
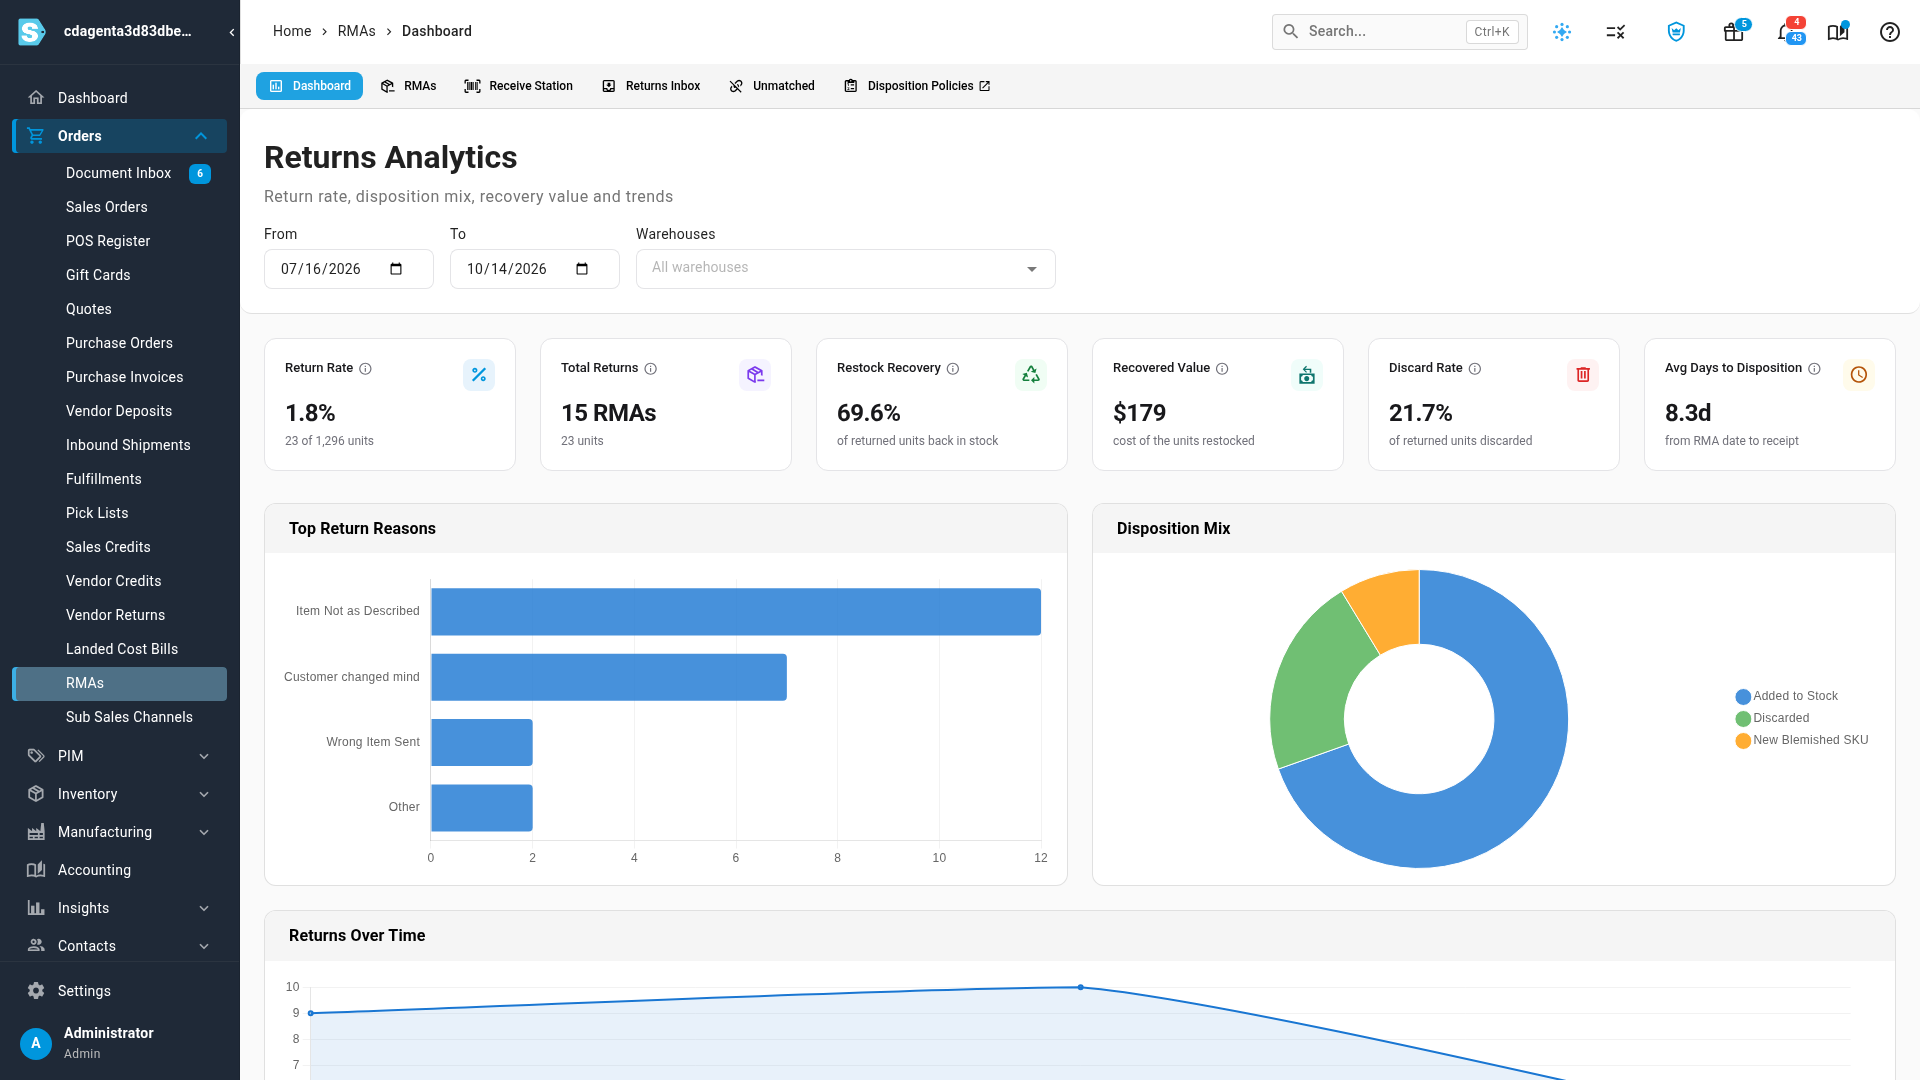
Set the period with From and To. The range starts at the last 90 days and counts returns by the day they were received. The page refreshes as soon as you change a date.
-
To look at one site, pick it under Warehouses. You can pick several. Leave it empty (All warehouses) to include every warehouse.
-
Read the six cards across the top. Hover the info icon beside a card's name for its definition.
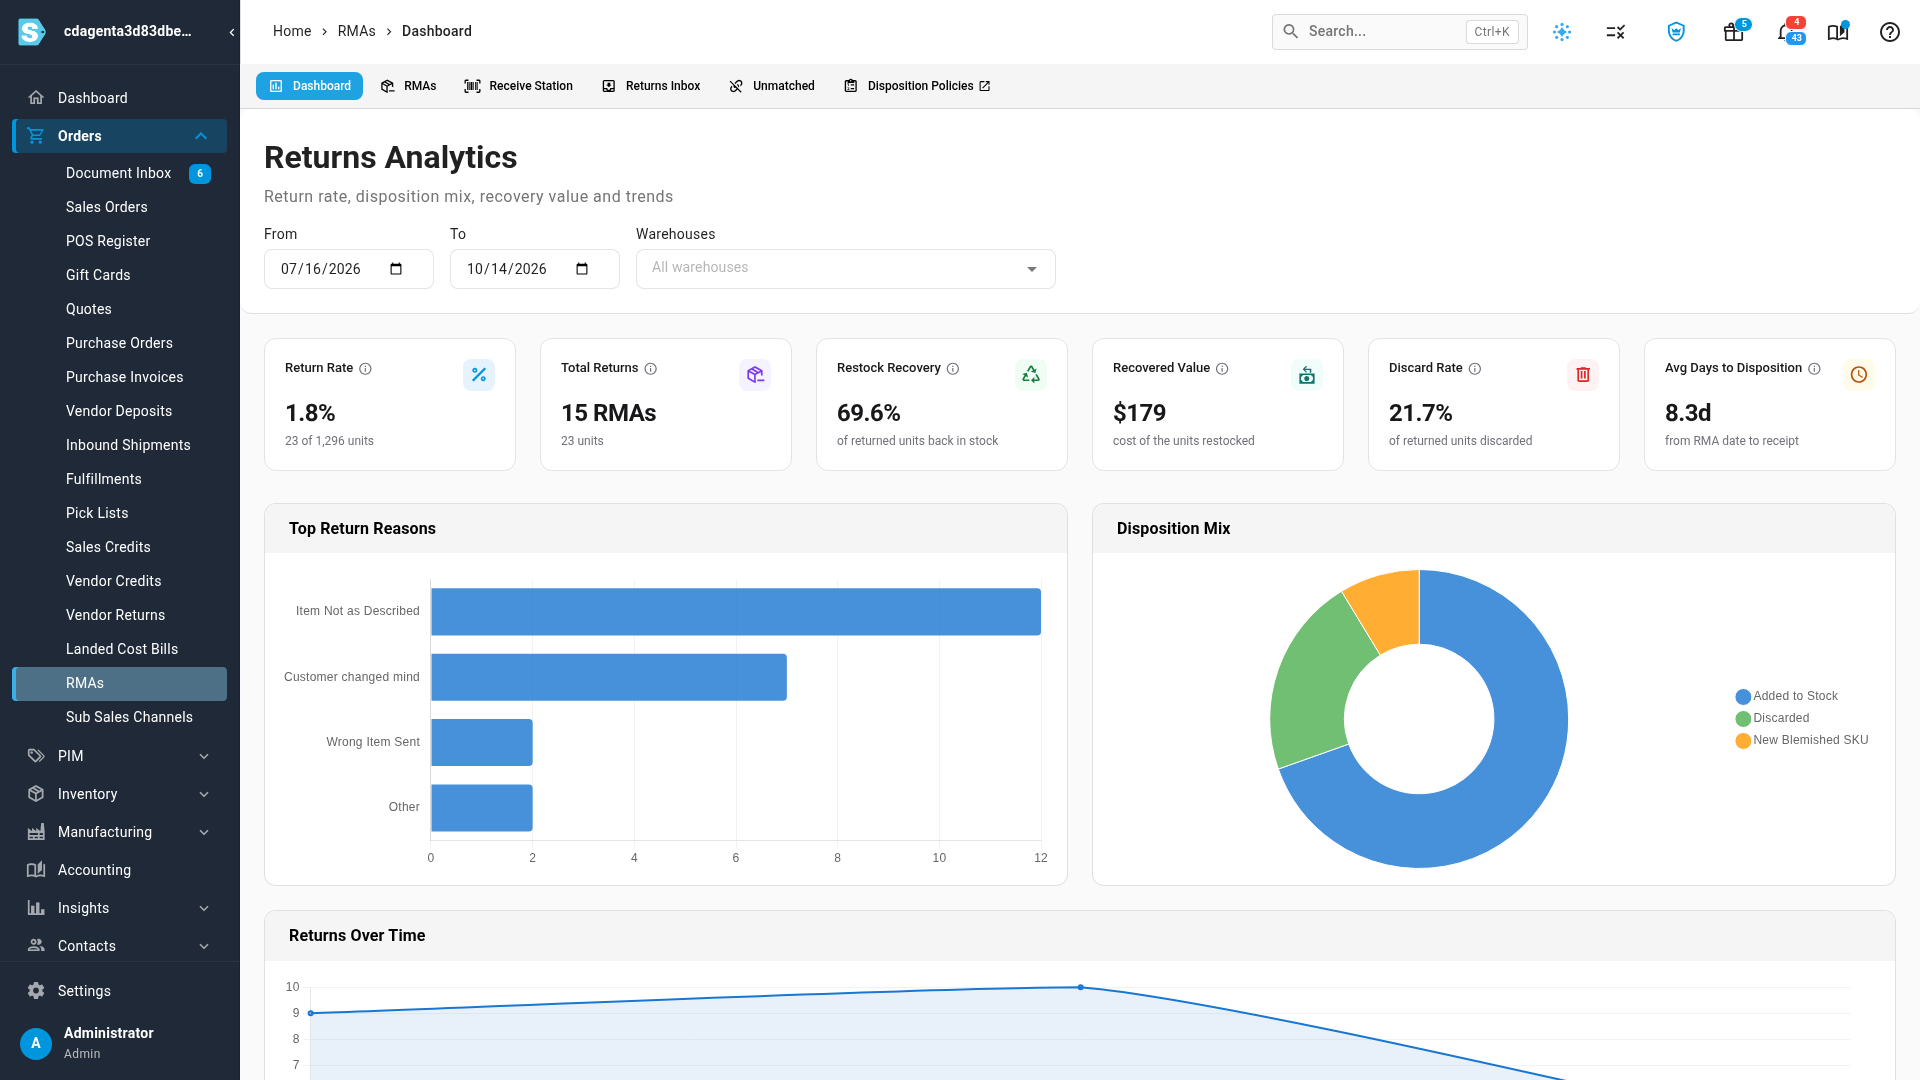
Card What it tells you Return Rate Units received back in the period, divided by units shipped on sales orders dated in the period. The line underneath shows both counts, for example 23 of 1,296 units. Total Returns How many RMAs had units received in the period, and how many units that was. Restock Recovery The share of returned units added back to stock. Recovered Value What the restocked units cost, so the stock value the returns gave back to you. Discard Rate The share of returned units you discarded. Avg Days to Disposition The average number of days from the RMA date to the day the return was received. -
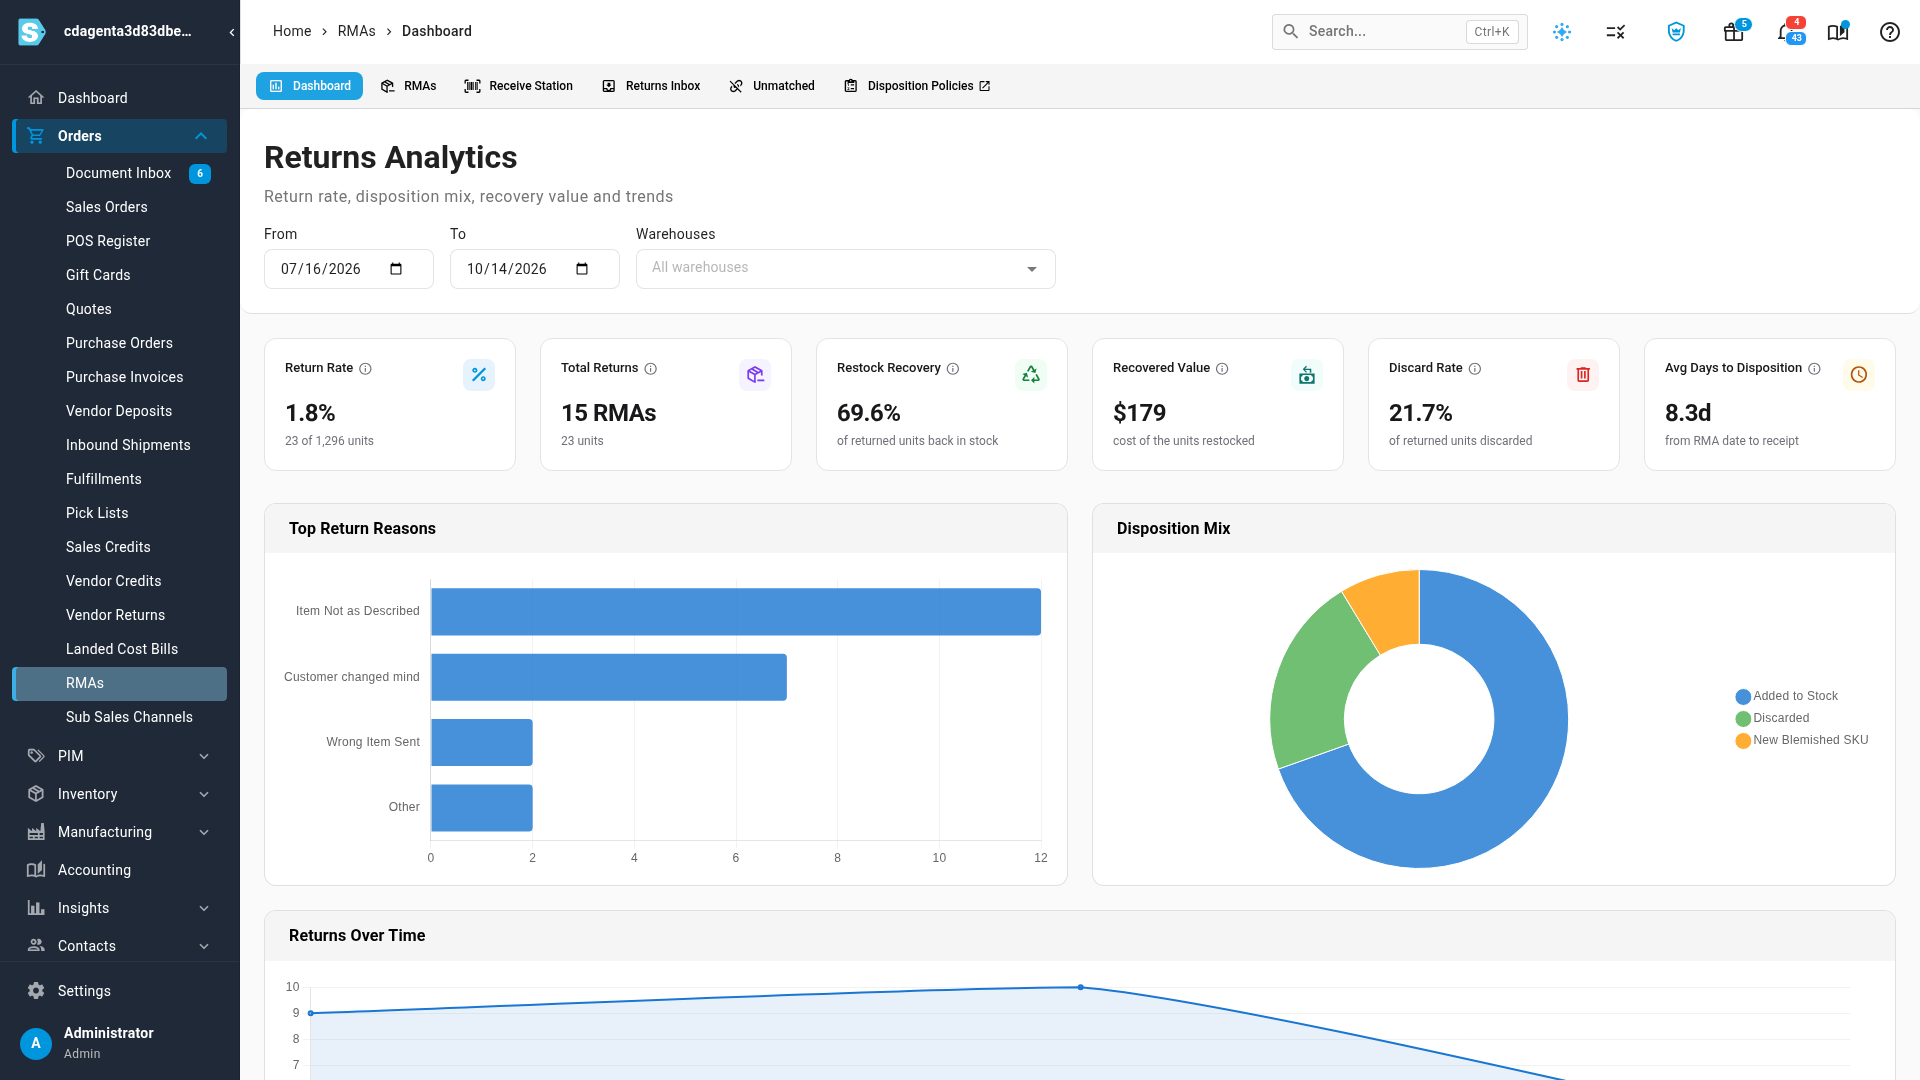
Read Top Return Reasons, which ranks the reasons customers gave by the number of units. Units received without a reason (the Receive Station doesn't require one) appear as Unspecified.
-
Read Disposition Mix, which splits the same units by what you did with them: Added to Stock, Discarded, or New Blemished SKU.
-
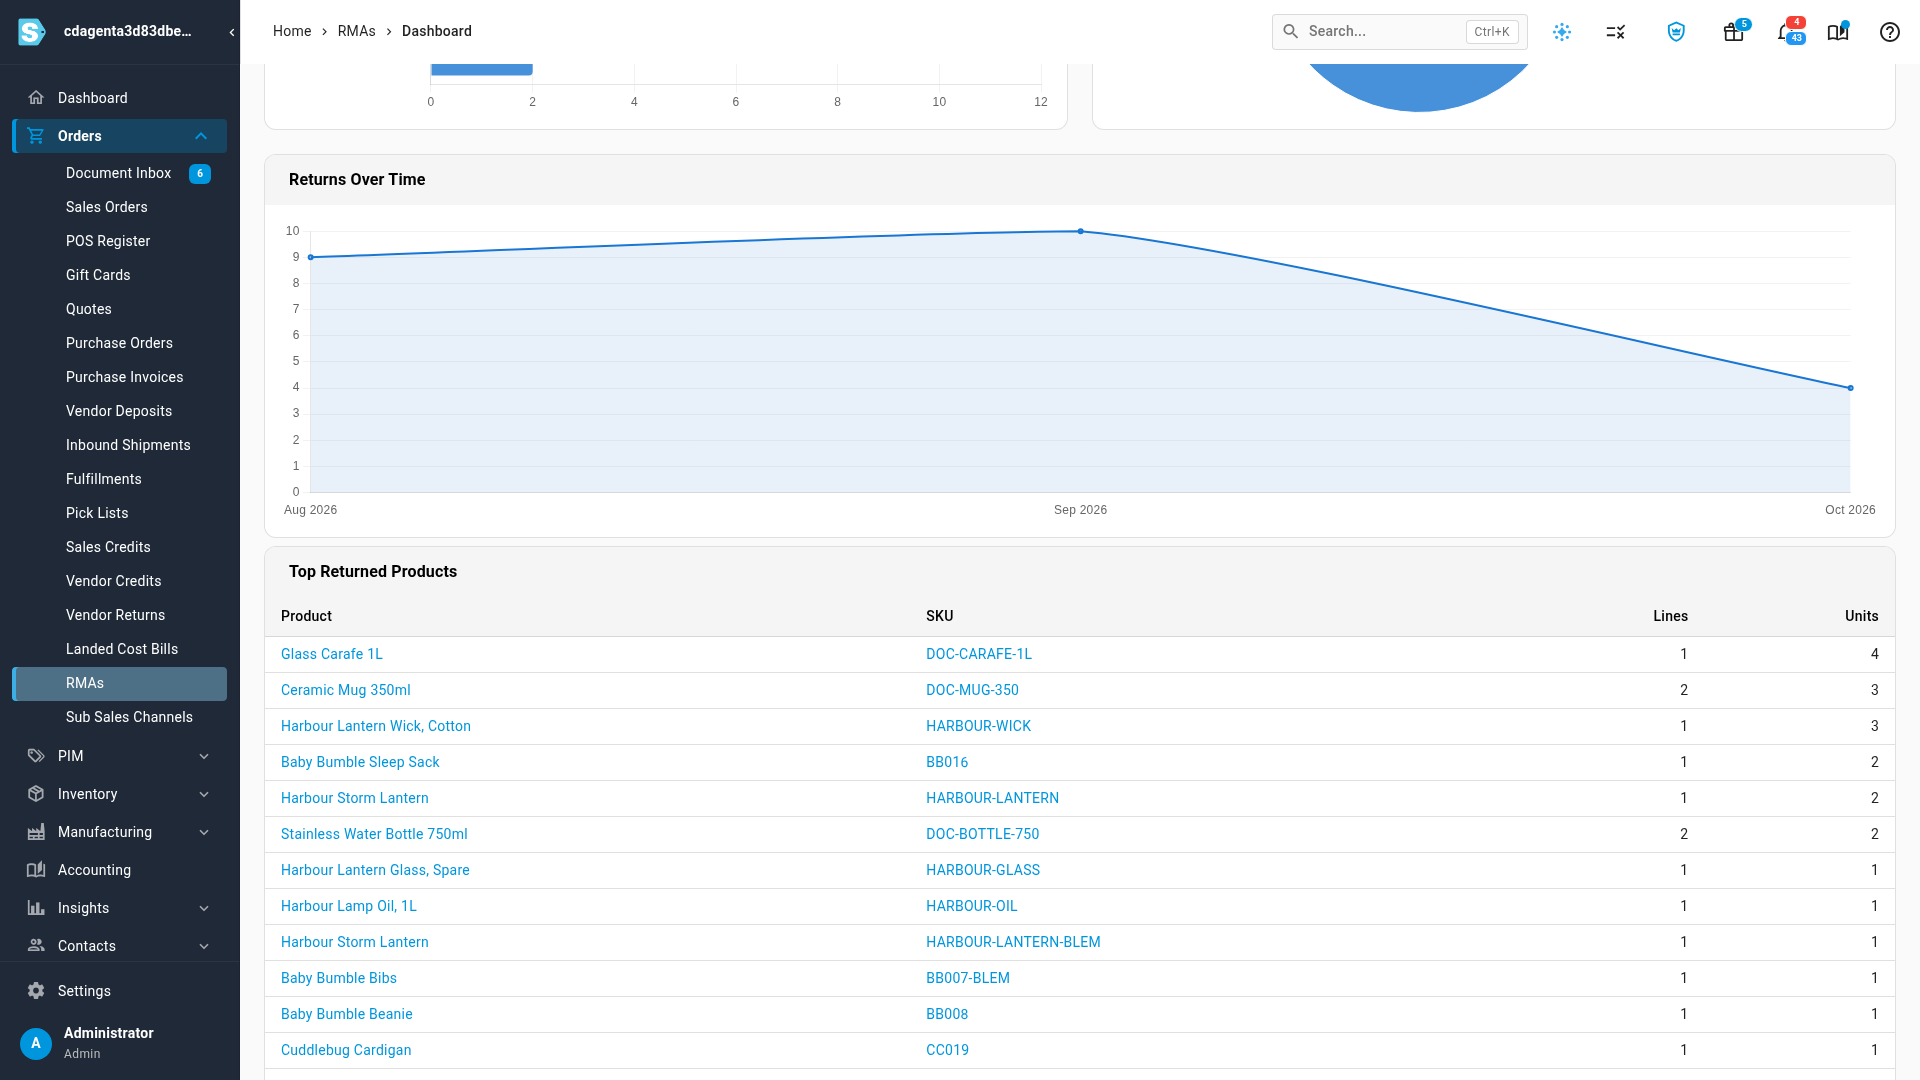
Scroll down to Returns Over Time, which plots the units received each month.
-
Read Top Returned Products, the 20 products with the most units returned in the period, with the number of return lines and units for each. Click a product's name or SKU to open it.
-
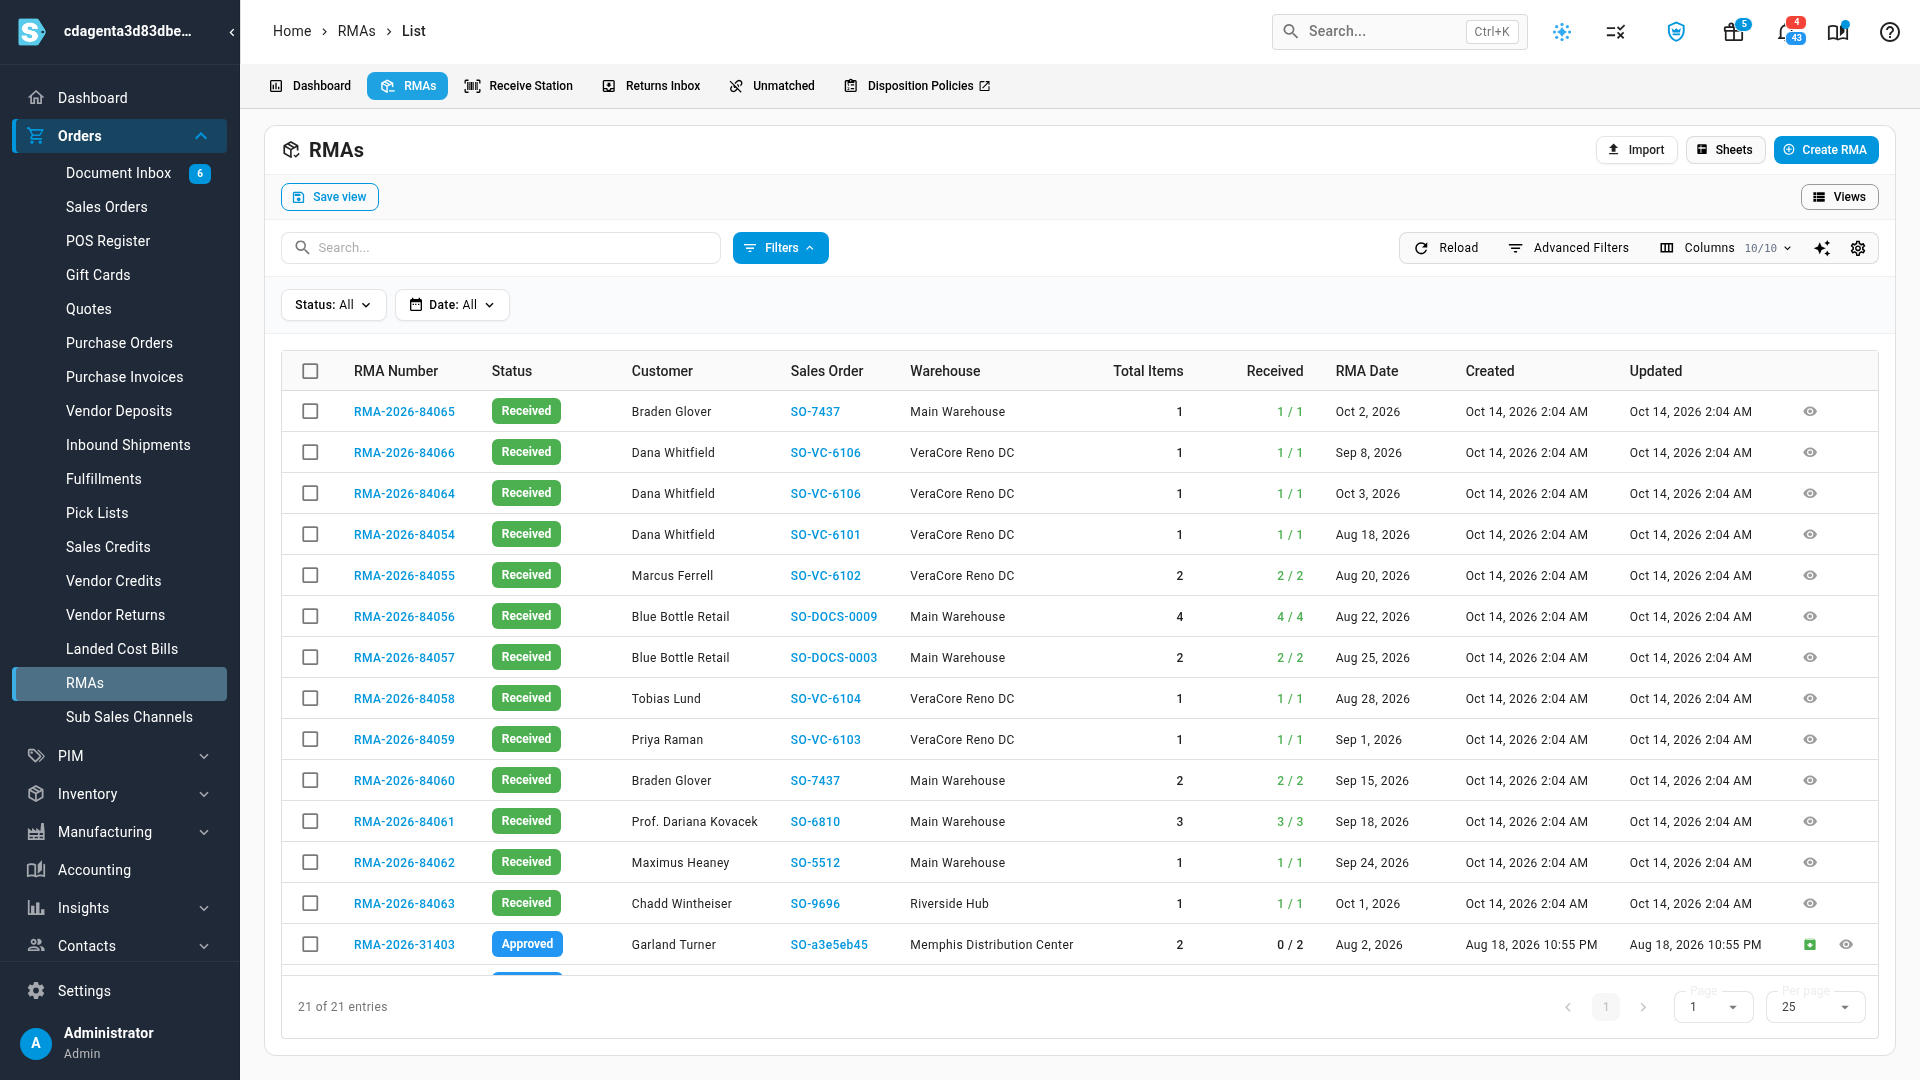
To act on a return, open the RMAs tab. It lists every return, whatever its status, and you open one there to approve, receive, or close it.
How the numbers relate
- Return Rate compares two different dates. The returned units are counted by the day you received them, and the shipped units by the date of the sales order. Returns usually arrive weeks after the sale, so a short range, such as the last two weeks, can show a rate that's far too high: it includes returns from older orders but only the newest orders' shipments. Use a range of a quarter or more when you compare return rates.
- Restock Recovery and Discard Rate don't add up to 100%. Units moved to a blemished SKU count in neither, so the gap between them is the share you kept as blemished stock.
- Recovered Value counts restocked units only. A unit moved to a blemished SKU isn't in it. The value is what the unit cost when you sold it.
- The dashboard and the RMAs list count different things. The list shows every RMA, including drafts and returns that are still on their way. The dashboard only counts units that were received in the period, so an approved RMA that hasn't arrived yet isn't in any card.
- Warehouses filters both sides of Return Rate. Returns count by the warehouse that received them, and shipped units by the warehouse each order line shipped from.
Next steps
- Process a customer return: authorize, receive, and close an RMA.
- Set up return disposition policies: default each returned unit to restock, discard, or a blemished SKU.
- RMA status reference: every RMA status and receive disposition.
- Returns, credits, and refunds: which step restocks inventory and which puts money back.
Video transcript
To see how your returns are trending, open Orders in the sidebar, and then choose RMAs. The returns area opens on its Dashboard tab, called Returns Analytics. Every number here counts returns you received between the From and To dates. It starts at the last ninety days. Change either date to look at another period. To see one site, pick it under Warehouses. Leave Warehouses empty to include them all. Return Rate compares units received back with units shipped on orders placed in the period. Underneath, you can see both counts. Total Returns counts the RMAs behind those returned units. The next cards show what happened to those units. Restock Recovery is the share you put back into stock. Recovered Value is what those units cost. Discard Rate is the share you discarded. Average days to disposition is the time from the RMA date to the day the return arrived. Top Return Reasons ranks why customers sent items back, by the number of units. Beside it, the Disposition Mix chart splits those units by outcome. Each unit was added to stock, discarded, or moved to a blemished SKU. Scroll down to Returns Over Time, which plots the units received each month. Below it, Top Returned Products lists the products that come back most, with their units. Each product name and SKU links to that product. To work on an individual return, scroll back to the top of the page. Then open the RMAs tab, which lists every return you have. Each RMA number links to that return, where you receive or close the RMA.