Review demand anomalies
A forecast averages your past sales, so one strange day can move every reorder quantity built on it. A wholesale order that landed in your web store, a duplicated import, or a week when a product sold out all look like demand to a plain average. Anomaly detection finds those days and lets you decide, one by one, what the forecast should do with them.
Before you begin
- Build a Sales Based forecast on Inventory → Demand Planning. See Forecast demand and replenish stock. Anomalies are found in the sales history of the forecast you have open.
How SKU.io spots an anomaly
For each product in the forecast, SKU.io works out what it expected to sell on every day of the history window. The expectation is the product's typical recent day, from a rolling two-week median, adjusted for the day of the week, so a normal busy Saturday isn't flagged. A day is flagged when its sales are far from that expectation compared with how much the product's sales usually vary. Each flag is one of these:
- Spike: far more sold than expected.
- Drop: far less sold than expected.
Dates inside a saved promo window are expected promotional demand, so treat spikes there as the promotion they are, not a mistake.
Detect anomalies
-
Go to Inventory → Demand Planning and build a forecast.
-
Below the results, find Anomaly Detection and click Detect Anomalies.

-
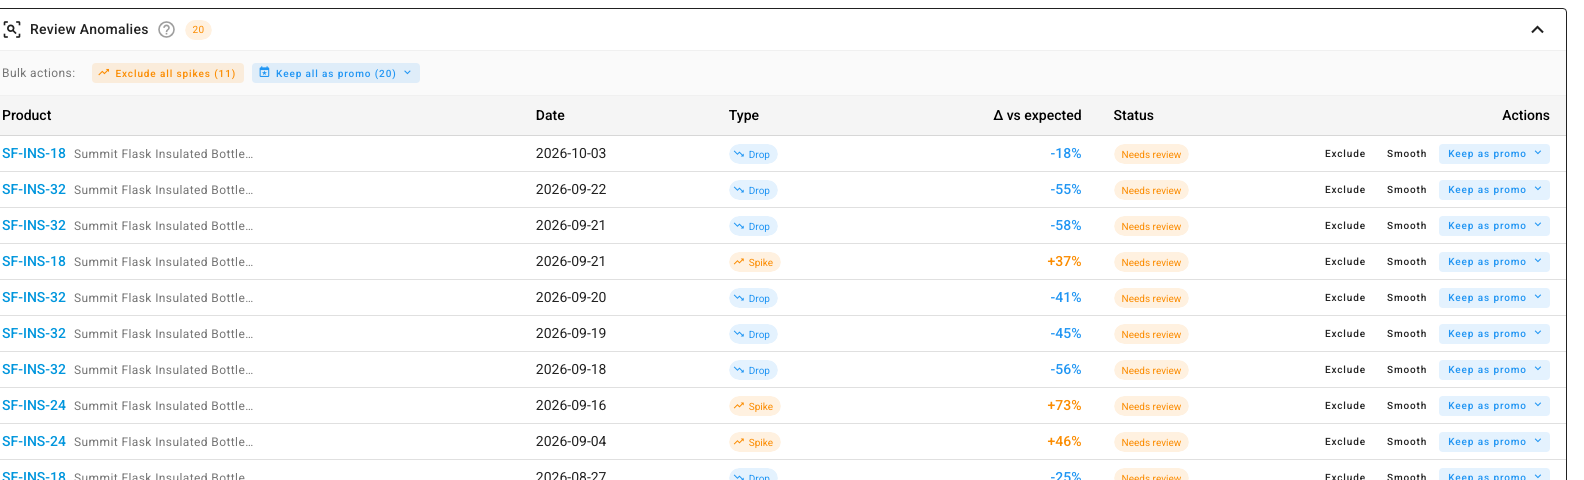
The Review Anomalies panel opens with the flagged days for every product in the forecast. The count next to the title is the number still waiting for review. Each row shows the product, the Date, the Type, how far sales were from the expectation (Δ vs expected), and the Status.
When you change the forecast's date range or products, click Re-detect Anomalies to scan again.
Decide what to do with each day
Every row starts as Needs review. Nothing changes in your forecast until you choose an action, and each choice only affects how the forecast reads that day. Your sales orders are never touched.
| Action | What it does | Use it for |
|---|---|---|
| Exclude | Leaves the day out of the average completely. | Days that weren't real customer demand, such as a one-off bulk order or a duplicate import. |
| Smooth | Counts the day at the expected amount instead of what sold. | Days that had real demand, but at a level that won't repeat. |
| Keep as promo | Tags the day to a promo window, which you pick or create from the menu. The day stays in the history and helps measure that promotion's lift. | Spikes caused by a sale, holiday, or launch you'll run again. |
The row's status changes to Excluded, Smoothed, or Kept (promo). To handle many rows at once, use the bulk actions above the table: Exclude all spikes excludes every spike still waiting for review, and Keep all as promo tags every waiting row to one promo window.
Use your decisions in the forecast
Your choices take effect when the forecast leaves anomalies out of its baseline.
-
In the forecast's Configuration, select Exclude detected anomalies from baseline.

-
Click Build Forecast again.
With the option on, the forecast removes the days you Excluded and counts the days you Smoothed at their expected level. Days still marked Needs review and days you Kept as promotions stay as they are. Review the flags first, then rebuild.
So a few bad days can't hollow out a product's history, the forecast ignores your exclusions when they would remove more than half the days in the window, and uses the history as it is. The calculation details for each line show how many anomaly days were excluded and smoothed. The same counts appear in the export when you include calculation details.
A day with no sales because the product was out of stock is flagged as a Drop when it falls well below normal. Exclude it so the days you couldn't sell don't pull the average down. SKU.io doesn't estimate the sales you lost while out of stock. See How sales velocity and days of supply work.
Next steps
- Plan for promotions with promo windows to measure the spikes you kept as promotions and plan the next one.
- Check how far to trust a forecast to see whether cleaning the history raised a line's confidence.