Plan for promotions with promo windows
A promotion creates two problems for a forecast. While it runs, sales jump, and a plain average reads that jump as your new normal and over-buys for the weeks after. Before the next one, a plain average knows nothing about the promotion and under-buys. A promo window solves both. It marks the promotion's dates so the spike is recognized as planned demand, measures how much the promotion actually lifted sales, and turns that measurement into an adjustment you can apply when you plan the next one.
Promo windows are saved, so a window you create for this year's Black Friday is still there, with its measured lift, next year.
Before you begin
- Build a Sales Based forecast on Inventory → Demand Planning for the products the promotion covered. See Forecast demand and replenish stock. Measuring a promotion needs the forecast's products and their sales history, so build the forecast first.
- Make sure the forecast's history window includes the promotion dates and at least two weeks after them.
Open promo windows
- Go to Inventory → Demand Planning and build the forecast.
- Below the results, in the Anomaly Detection bar, click Promo Windows.
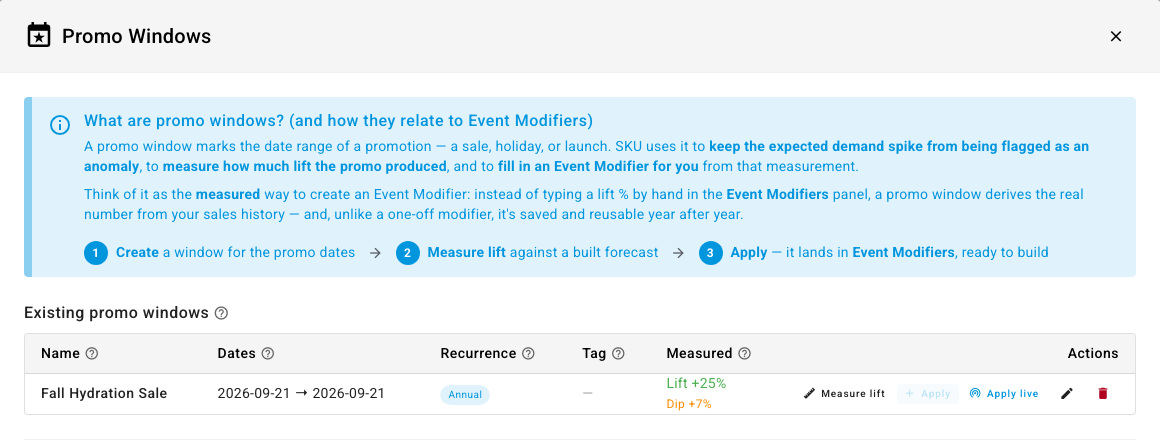
The dialog opens with a short explanation and the list of Existing promo windows.
Record a promotion
- Scroll to New promo window.
- Enter a Name you'll recognize, for example "Back to School Sale".
- Set the Start date and End date. Both days count as part of the promotion.
- Choose the Recurrence: One-off for a single event, or Annual for a promotion that repeats on the same dates every year.
- Optional: enter an Order tag if your orders for this promotion carry a tag, such as BLACKFRIDAY. Leave it blank to measure by the dates alone.
- Click Create Window.
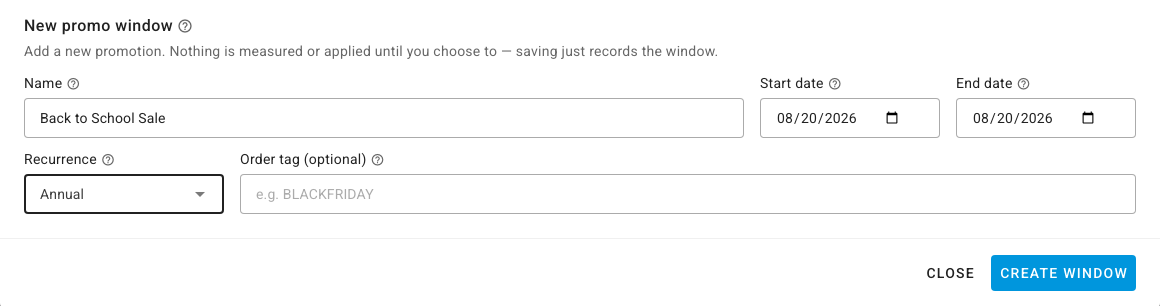
Saving only records the dates. Nothing in your forecast changes until you measure and apply the promotion.
Let SKU.io find past promotions
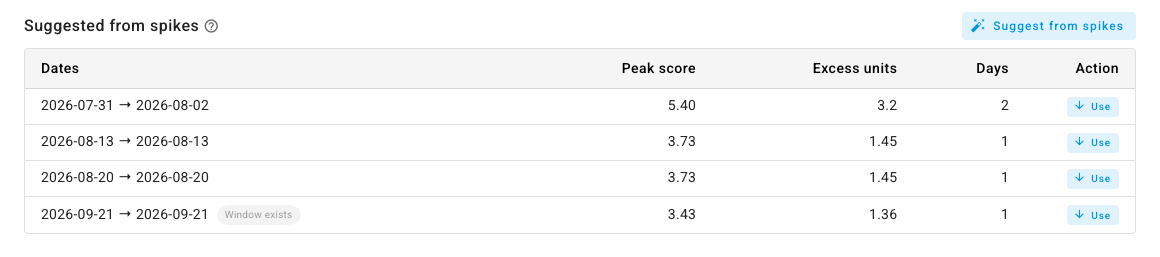
If you don't know exactly when past promotions ran, click Suggest from spikes. SKU.io scans the sales history of the forecast's products for clusters of unexplained spikes and lists them with their Dates, a Peak score (how unusual the spike was), the Excess units sold above normal, and the number of Days. Click Use on a row to copy its dates into the new promo window form. A Window exists label marks dates you've already saved.
Measure the lift
- In Existing promo windows, click Measure lift on the promotion's row.
- Read the Measured column:
- Lift is how much higher daily sales ran during the promotion than on comparable normal days. +25% means a quarter more than usual.
- Dip is how sales compared with normal in the 14 days after the promotion. A negative number means customers bought early and sales fell afterwards. A positive number means sales stayed above normal.
SKU.io compares each promotion day with a normal day of the same weekday, so a weekend promotion isn't flattered by being compared with quiet weekdays. Measuring only reads your history. You can measure again at any time to refresh the numbers.
Apply the promotion to your forecast
You have two ways to use a measured promotion. Both are added to the forecast's Demand Modifiers panel, where you can review or remove them before you build.
- Apply adds the promotion's next occurrence, on the same dates a year later, as event modifiers: one for the lift during the promotion and one for the dip in the 14 days after it. Use it when the forecast you're building covers the coming promotion and you want the extra units for those days added to the order. Apply is available right after you click Measure lift in the dialog.
- Apply live multiplies the forecast's whole daily rate by the promotion's measured lift, and re-reads the lift every time the forecast is built. Use it when you're ordering stock for the promotion itself. Because the lift is a multiplier, it scales with your current sales: a product that has doubled since last year gets twice the extra units. If you measure the promotion again, the next build picks up the new lift.
After you apply, close the dialog and click Build Forecast. The Demand Modifiers panel lists what's in effect.

To see how a promotion changed a particular line, click the line's calculator icon. With Apply live, the calculation shows the promotion's factor and the baseline it multiplied. For a worked example of a promotion stacked on a growing product, see Forecast with trend-aware baselines.
Keep promotions out of your everyday baseline
When you review demand anomalies, a spike that came from a promotion can be tagged to its promo window with Keep as promo. The day stays in your history, marked as part of that promotion, instead of being excluded or smoothed away as a mistake. Pick New promo window… from the same menu when the promotion isn't saved yet.
Edit or remove a promotion
On the promotion's row, click the pencil icon to change its name, dates, recurrence, or tag, or the delete icon to remove it. Measure the lift again after you change the dates.
Next steps
- Review demand anomalies to tag promotional spikes and clean the rest of the history.
- Replenish stock on a schedule to run a forecast with its promotions automatically.