Build a report by describing it
You don't have to know which table holds a number to report on it. In a custom report, Report Builder AI turns a sentence such as Top 10 products by revenue in the last 90 days into a working report: it picks the data source, places the rows, columns, and values, adds the filters, and runs it. Everything it sets up lands in the normal report controls, so you can check it and change it like any report you built yourself.
Before you begin
- Someone on your account must set up an AI provider under Settings → AI Assistant. Report Builder AI uses the same provider and key as the AI Assistant.
- You need access to Custom Reports. Report Builder AI reads the fields your report can use and runs the report against your own data. It doesn't change any records.
Steps
-
Go to Insights → Reports, open Custom Reports, and click New Report.
A short tour runs the first time. Click Skip to close it, or Next to follow it.
-
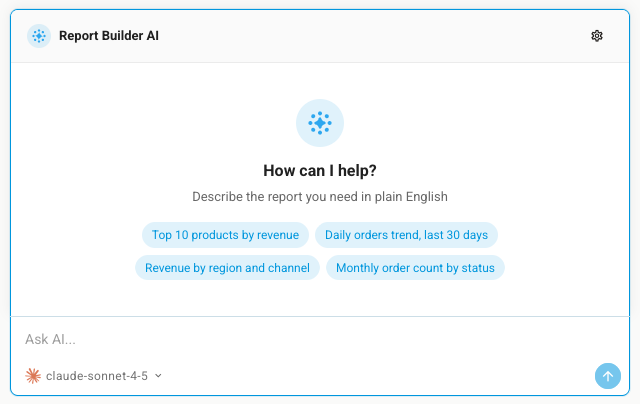
Click Ask AI... at the bottom of the report.
The Report Builder AI panel opens with a few suggestions you can click.
-
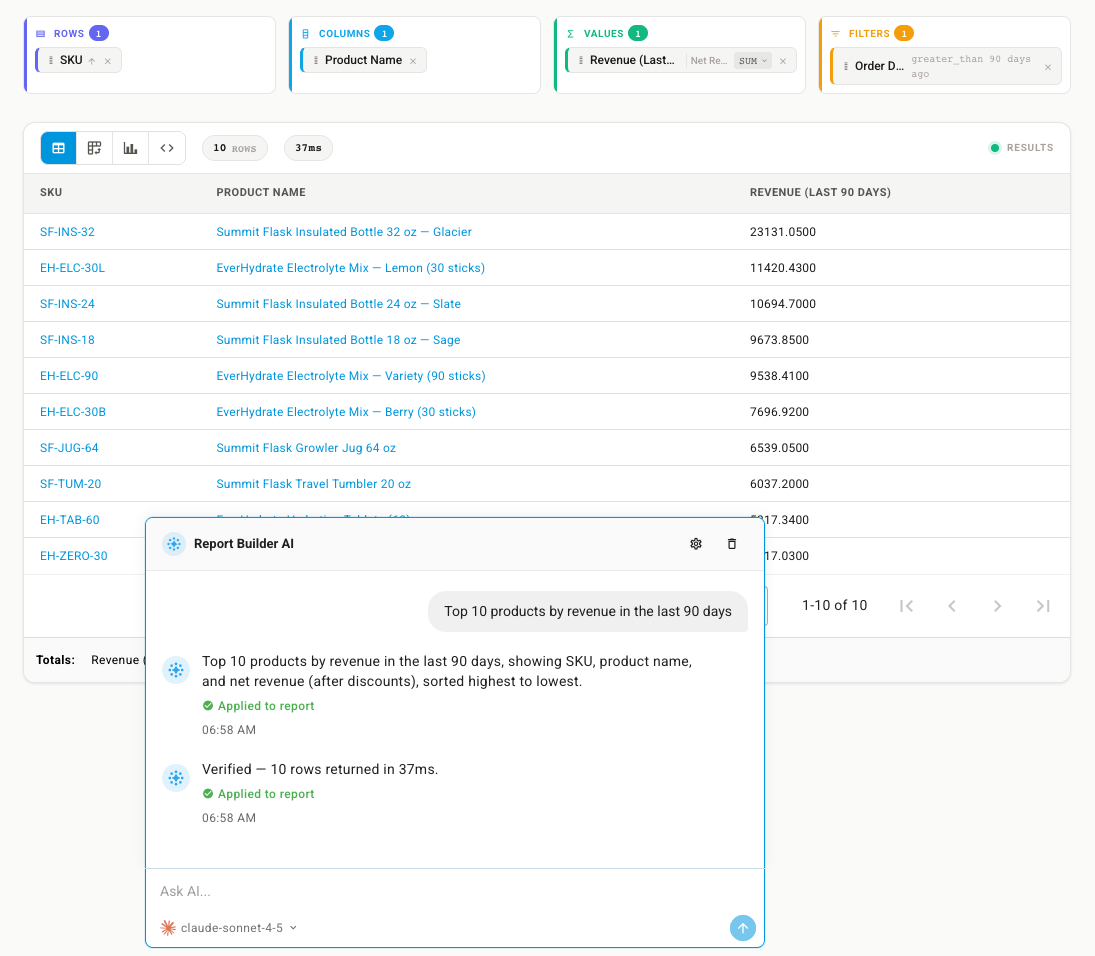
Describe the report, for example Top 10 products by revenue in the last 90 days, and press Enter.
The panel shows what it's doing, then reports what it built, such as "showing SKU, product name, and net revenue (after discounts), sorted highest to lowest", with Applied to report underneath. It then runs the report and confirms how many rows came back.
-
Check what it set up before you trust the numbers:
- Domain and Base Entity on the left show which data it chose.
- Rows, Columns, Values, and Filters across the top show how it laid the report out.
- Filters on the right show each condition in full, such as the date window.
-
Refine it. Either type a follow-up in the same panel, such as also show quantity sold, or change the fields, filters, and sort by hand.
-
Give the report a Report Name on the right and click Save.
Tips for a good description
- Say what to measure and how to group it. "Revenue by channel" works better than "sales stuff".
- Give a time window. "Last 30 days" or "this quarter" becomes a date filter.
- Ask for a limit or an order. "Top 10" or "highest to lowest" sets the sort and the row limit.
- Ask again to adjust. Each follow-up changes the current report rather than starting over. Click the bin icon in the panel to clear the chat.
To check which AI provider and model the panel uses, click the gear icon in the Report Builder AI panel.
Next steps
- Reports catalog — the ready-made reports, in case one already answers your question.
- Ask the AI Assistant — quick questions about your data without building a report.
- AI & Automation — every AI feature in SKU.io.