Use the Feature Adoption report
Feature Adoption shows which parts of SKU.io your team uses, who uses each one, and which features you haven't tried yet. Use it to check that a rollout landed, to spot people who have gone quiet, and to find features worth a look. When a feature will never fit your business, hide it so the report stops suggesting it.
Before you begin
- To open the report, your role needs access to the Feature Adoption report. Admins have it by default.
- To hide or restore features, your role needs the Manage permission for Feature Adoption. Admins have it by default. Without it, the report is read-only.
- The report needs history to show anything useful. A brand-new account shows We're gathering your team's activity. Check back tomorrow. until the first nightly update.
How usage is counted
- A feature counts as used when someone does its main job, such as creating or editing a sales order or receiving a purchase order. Each feature's details panel says exactly what counts, in a sentence that starts Counted as used when…. Opening a list without doing anything shows as viewed only and doesn't make a feature active. Reports are the exception: opening one counts as using it.
- Activity is counted in days, not clicks. A person who works in a feature on 12 different days has 12 active days, however many clicks that took. SKU.io keeps daily totals only, never a record of individual clicks or timestamps.
- Some features run on their own. A connected sales channel that syncs orders overnight is in use even when nobody signs in to it. Its card shows automatic next to the faces of the people who used it.
- SKU.io's own support team never counts. When our team signs in to help you, that activity is left out of the report, and support staff never appear in the People list or count toward your seats.
- Feature statuses refresh nightly, and today's activity is included. The header shows when the statuses were last updated, for example Updated 3:51 PM · live activity included.
Open the report
- Go to Insights → Reports.
- Click Feature Adoption.
The report opens on the Features tab and covers the last 30 days. Switch to 90 days in the top right for a longer view. The window applies to every number on the page, including the People tab.
Read the summary
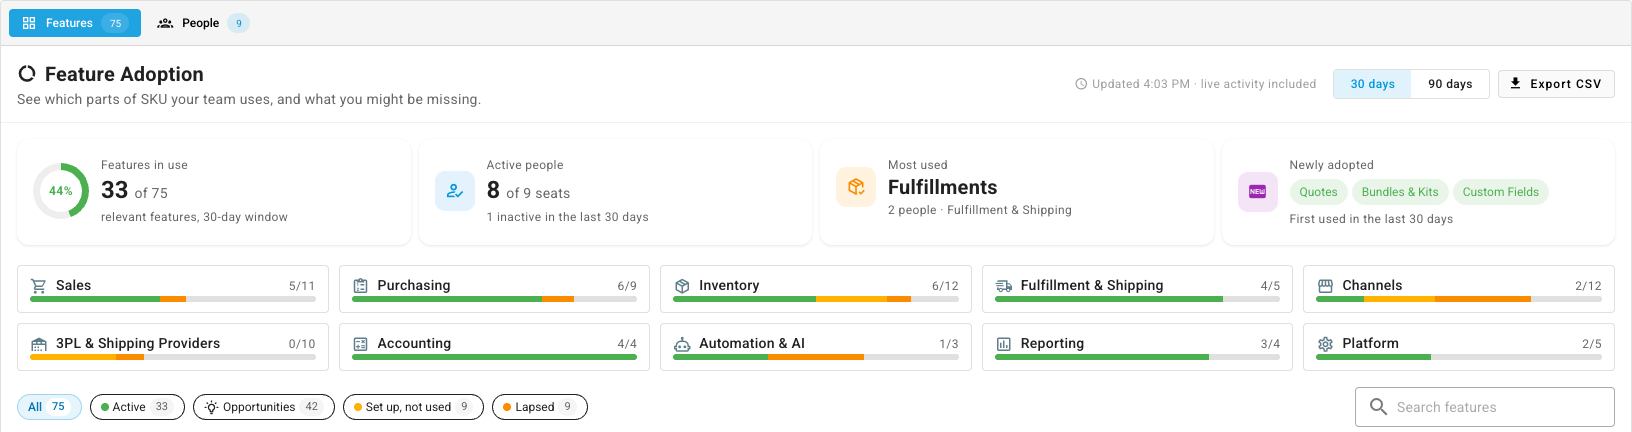
The four cards across the top sum up the window:
| Card | What it tells you |
|---|---|
| Features in use | How many features someone used at least once, out of the features that are relevant to you. Hidden features and features that aren't on your plan don't count toward the total. |
| Active people | How many people used SKU.io in the window, out of your seats. The line underneath counts the people who were inactive. |
| Most used | The feature with the most active days across your team, and how many people use it. |
| Newly adopted | Features your team used for the first time inside the window. |
Under the cards, one tile per area (Sales, Purchasing, Inventory, Fulfillment & Shipping and so on) shows how many of that area's features are in use, with a bar split by status.
Read a feature card
Every feature has a card, grouped by area. Each card shows:
-
A status:
Status Meaning Active Someone used it in the last 30 days. Set up, not used yet It's connected or configured, but nobody has used it. Lapsed Your team used it before, but not in the last 30 days. Not started Nobody has set it up or used it. Not on your plan Your plan doesn't include it. It's left out of your score. -
The faces of the people who used it in the window, with automatic when it also ran on its own.
-
A line of daily activity for the last 30 days. Hover over it to see what it plots.
-
When it was last used, and an action: View details for a feature in use, Get started, Finish setup or Pick it back up for one that isn't, and Guide to open its guide on this site.
To narrow the list, click a filter above the cards: All, Active, Opportunities, Set up, not used or Lapsed. To find one feature, type its name into Search features.
See who uses a feature
-
On a feature's card, click View details.
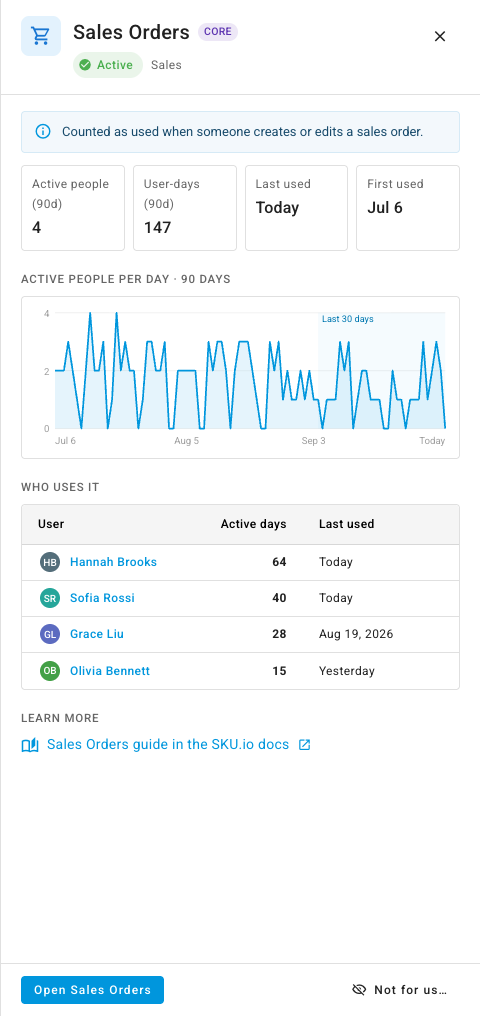
The panel opens with a banner that says what counts as using this feature, the number of active people, the total user-days, and when the feature was first and last used. A chart plots active people per day over 90 days, with the last 30 days shaded.
-
Read Who uses it for each person's active days and the day they last used the feature.
-
To go to the feature, click Open followed by the feature's name at the bottom of the panel.
Find what you're missing
-
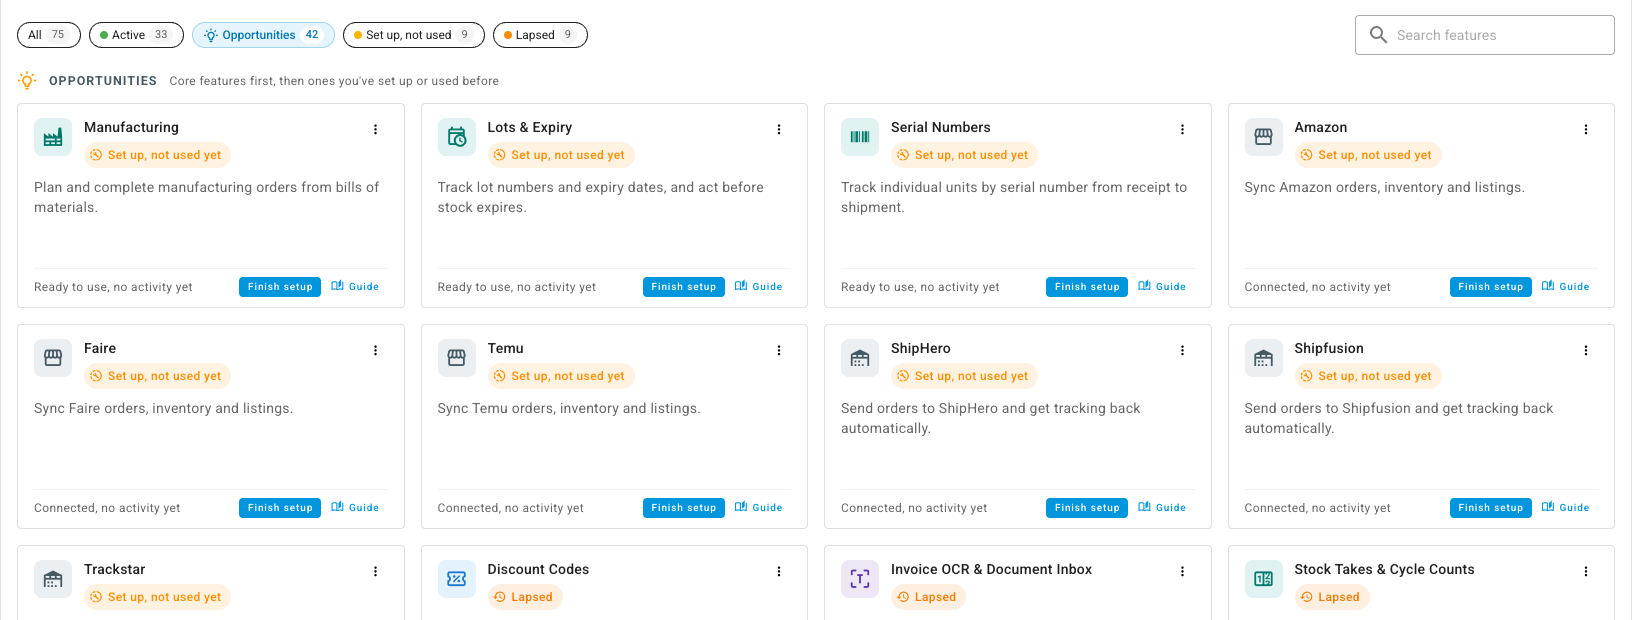
Click Opportunities.
The list keeps only the features you aren't using yet. Core features come first, then the ones you've set up or used before, then the rest.
-
On a card, click Finish setup, Get started or Pick it back up to go straight to the screen where you start, or Guide to read about it first.
Hide a feature you'll never use
Hiding a feature takes it out of your score and your suggestions. It doesn't change any menu or permission, and anyone with access can still use it.
- On the feature's card, open the menu (⋮) and choose Not for us… to open the dialog.
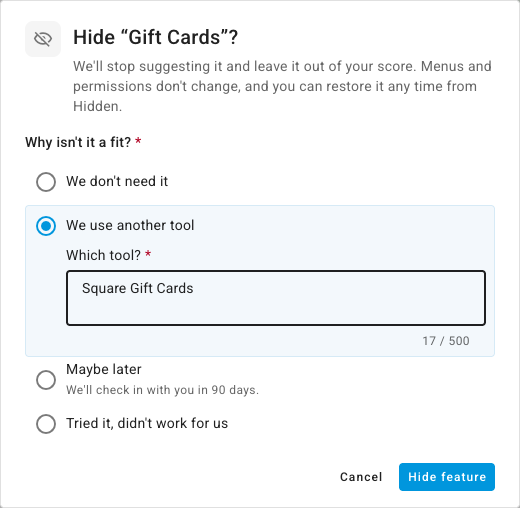
- Under Why isn't it a fit?, choose a reason:
- We don't need it
- We use another tool, then type the tool's name under Which tool?
- Maybe later. The feature comes back on its own after 90 days.
- Tried it, didn't work for us, then say what got in the way under What got in the way?
- Click Hide feature.
The card moves to the Hidden section at the bottom of the page. A message confirms it, with Undo for a few seconds if you picked the wrong card.
If your team used the feature in the last 30 days, the dialog warns you first: Your team used this in the last 30 days — hide anyway?
Hide a whole group at once
The Channels, 3PL & Shipping Providers and Accounting areas have a shortcut in their header: We don't sell on marketplaces, We don't run our own storefront, We don't use a 3PL and We don't do our books in SKU. The dialog lists the features under Will be hidden and the button shows how many, for example Hide 9 features. A feature your team has used is never included.
Hiding the whole group also marks the matching step of the setup guide as Not for us. For example, hiding every channel skips the sales-channel step.
A hidden feature you start using comes back
If someone uses a hidden feature on a later day, SKU.io moves it back into your features at the next nightly update. A banner says so, for example You've started using Amazon, so we've moved it back into your features. Close the banner to dismiss it.
Restore a hidden feature
-
At the bottom of the Features tab, click Hidden to expand it.
Each hidden feature shows its reason, who hid it and when. A Maybe later feature also shows the date it comes back.
-
Click Restore next to the feature.

See who uses what
-
Click the People tab.
Each row is a person, with their role, the last day they were active, their active days in the window and how many features they used. Each small square is one feature, grouped under its area. The darker the square, the more days that person used the feature: none, 1–3, 4–10 or 11+ days. An outlined square means viewed only. Hover over a square for the exact number of days.
-
Read the Team coverage row under the table to see how many people on the page use each feature.
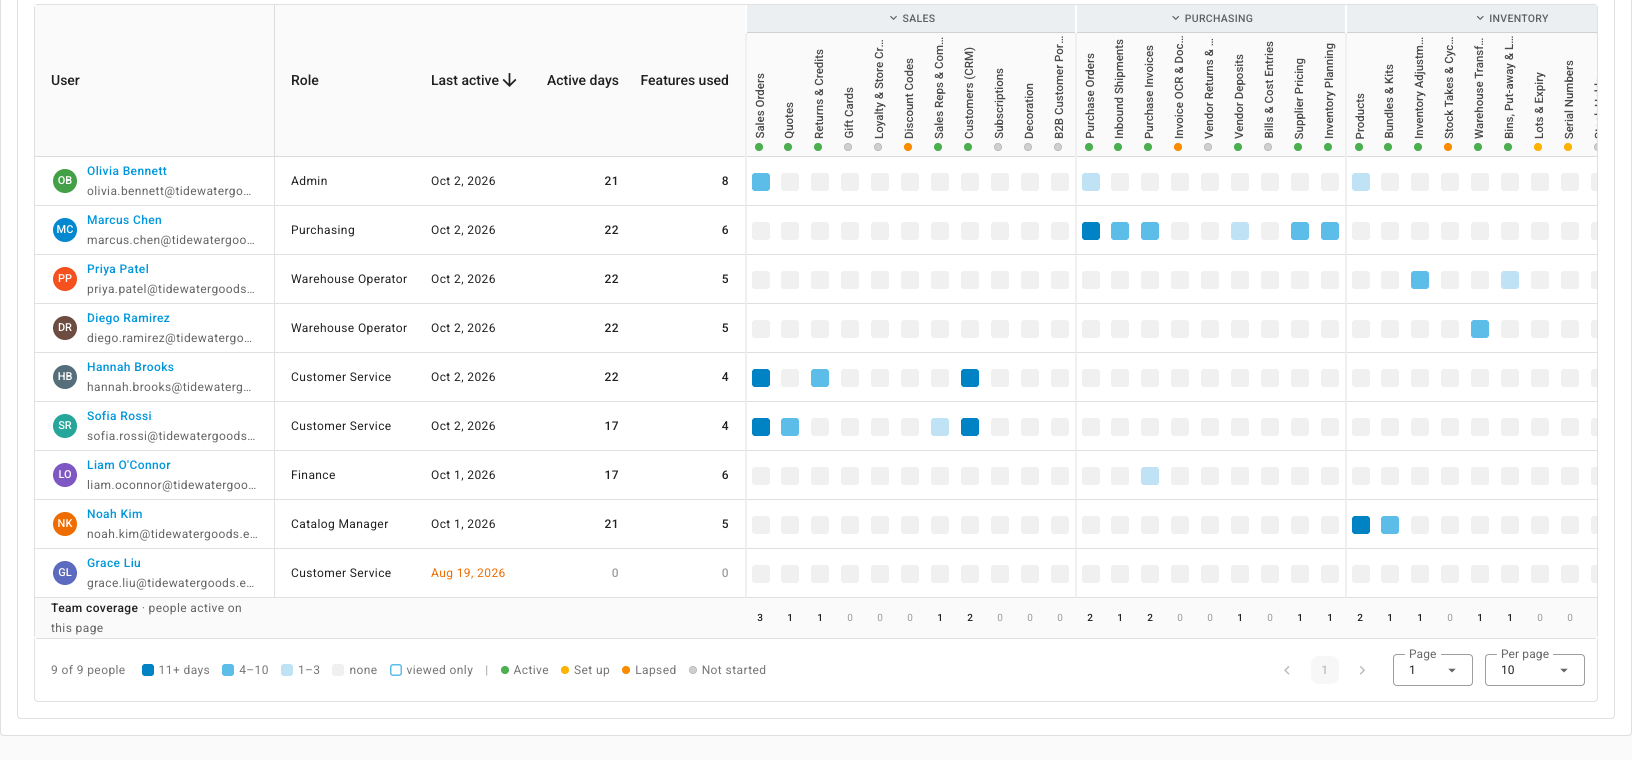
To focus the table:
- Role shows one role at a time.
- Inactive only keeps the people who did nothing in the window.
- Show former users adds people who have left your account, marked Former. They never count toward your seats.
- Collapse all areas folds each area into a single column.
- Sort by Last active, Active days or Features used by clicking the column header.
Look at one person
-
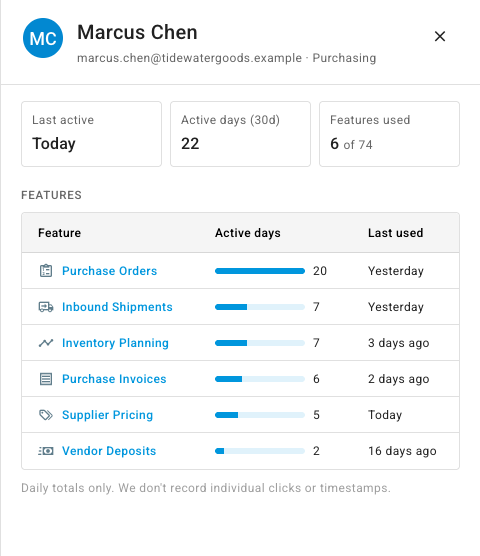
On the People tab, click a person's name.
The panel shows the last day they were active, their active days and how many features they used, then each feature with its active days and the day they last used it.
Export the report
- Click Export CSV in the top right.
The file has one row per person and one column per relevant feature, with the number of active days in each. Former users aren't included. The first columns are User ID, Name, Email, Role, Last Active, Active Days (with the window, for example Active Days (30d)) and Features Used. Small exports download straight away. A large one runs in the background, and you can track it in the job tray.
Next steps
- Reports catalog: every other report under Insights → Reports.
- Create a role: give a role access to the report, or the permission to hide features.
Video transcript
To see which parts of the app your team actually uses, start with the sidebar. Open the Insights menu on the left, then choose Reports underneath it. Then pick Feature Adoption, near the top of the list that opens on the right. It opens on the Features tab, covering the last thirty days. The cards across the top sum up the window you picked. Features in use counts the features someone worked in at least once. Active people compares your active team with your seats. Most used and Newly adopted show where the momentum is. Below, every feature gets a card, grouped by area. The status says whether it is active, set up but not used yet, lapsed, or not started. The faces show who used it, and the line shows activity day by day. Click View details to open a feature. The banner says exactly what counts as real use of this feature. Below the trend, Who uses it lists each person, their active days, and their most recent day of use. When you are done with the details, close the panel. Then click Opportunities, in the filters above the cards. Now you only see features you are not using yet, with the core ones first. Each card links to a guide, or straight to the screen where you start. Some features will never fit your business, and you can hide them from the report. Open the menu in the corner of its card, and choose the Not for us option. Pick the reason that fits your business best. Then click Hide feature to confirm your choice. It leaves your score and your suggestions, and your menus stay exactly as they were. Hidden features collect in their own list, at the very bottom of the page. Expand it to see each feature with the reason you gave. Scroll down to see them all, and use Restore to bring one back whenever you change your mind. Scroll back to the top, and switch to the People tab to see who uses what. Each row is a person, and each square is one feature. Darker shading means more days of use, as the legend under the table shows. Click a name to see that person's features. Each feature lists their active days, and their most recent day of use. Close the panel when you are finished. Then switch the window to ninety days, for a longer view. It never tracks individual clicks, only who was active on each date.