
Which Product Deserves Your Next Inventory Dollar?

Margin percentage cannot answer that question, because margin has no dates in it. In the example further down this page, a product with a 35% margin returns 134% a year and a product with a 10% margin returns 223% — the second one’s money came back in 35 days instead of 258. Internal rate of return, usually written IRR, is the number that sees the difference. It is what I use to decide where inventory money goes, and I call it the great equalizer.
Originally published August 2020. Rewritten August 2026, after the calculation this page describes finally went into the product, with new worked examples and the objections. Quotes are verbatim from recorded calls in our own archive, attributed by role with names withheld.
I should say up front that I wrote the first version of this page in 2020 and then did nothing with it for five years. On a call in October 2025 I admitted as much to a consultant I work with: the IRR idea was “something I had from the beginning of SKU. I haven’t implemented it.” It went into the product in July 2026, six years after I wrote the essay. The delay is the interesting part, and I’ll come back to it, because the reason was never the arithmetic.
Why does margin percentage pick the wrong product?
Because margin prices one sale, and a purchase order is not one sale — it is money that leaves your bank on a date and comes back over a series of later dates. Two products can have the same margin and behave like completely different investments depending on how long your cash was gone.
In a world with unlimited capital this wouldn’t matter. You would stock everything with a positive margin and stop thinking. But capital is the constraint, always, so carrying one product means not carrying another, and the question is not “is this profitable” but “is this the best thing I can do with the money.”
The head of marketplaces at a supplements brand, on a call where I walked through this for the first time:
“Oh, that’s cool. I’ve never heard of that. That’s good to know… because right now we’re pricing products based off of our overhead.”
Pricing off overhead is not wrong. It is how you set a price. It just doesn’t tell you which purchase order to raise on Monday when there’s only enough cash for one of them.
What is internal rate of return (IRR)?
IRR is the annualized rate of return implied by a series of dated cash flows. Feed it the money you paid and the money you got back, with the date against each amount, and it returns the effective annual rate that makes those flows balance. Spreadsheets compute it with XIRR. It is standard practice in property development and private equity, which is where I learned it before I sold anything online.
Here are two phone cases. Same $10 sale price, ten units each.
iPhone Case 10a — 35% margin: $6.50 landed cost, $3.50 profit per unit.
| Date | Amount | Description |
|---|---|---|
| 1 Jan 2020 | −65.00 | Purchase order, 10 units |
| 1 Apr 2020 | 10.00 | Sale × 1 |
| 20 Apr 2020 | 10.00 | Sale × 1 |
| 3 Jun 2020 | 20.00 | Sale × 2 |
| 3 Jul 2020 | 10.00 | Sale × 1 |
| 15 Aug 2020 | 10.00 | Sale × 1 |
| 23 Aug 2020 | 30.00 | Sale × 3 |
| 15 Sep 2020 | 10.00 | Sale × 1 |
| IRR | 134.34% | |
iPhone Case 11a — 10% margin: $9.00 landed cost, $1.00 profit per unit.
| Date | Amount | Description |
|---|---|---|
| 1 Jan 2020 | −90.00 | Purchase order, 10 units |
| 1 Feb 2020 | 10.00 | Sale × 1 |
| 2 Feb 2020 | 30.00 | Sale × 3 |
| 3 Feb 2020 | 40.00 | Sale × 4 |
| 4 Feb 2020 | 10.00 | Sale × 1 |
| 5 Feb 2020 | 10.00 | Sale × 1 |
| IRR | 223.01% | |
The Google Sheet with both calculations is still public, and you can change the dates to see how much they matter.
Two things did the work. The 11a cash came back in five weeks and the 10a cash took over eight months, which is 258 days versus 35. And the 10a stock took roughly three months to arrive after the money left, against one month for the 11a — lead time is cash you have already spent on stock you cannot sell yet, and it is the most under-priced number in purchasing.
On margin, 10a wins by a distance. On where to put the next dollar, it isn’t close.
Isn’t that what GMROI already does?
Partly, and if you already run gross margin return on inventory investment — GMROI, gross margin dollars divided by the average value of inventory at cost — you are ahead of most operators. It does blend margin with turns, which is more than margin alone does. Written out it reduces to turns × margin ÷ (1 − margin), so a 25%-margin SKU turning twelve times a year scores 4.0 against 3.0 for a 60%-margin SKU turning twice, and GMROI correctly prefers the cheaper, faster one. Do the arithmetic before you trust that instinct, though: drop the fast SKU to eight turns and it scores 2.7, and the 60% SKU wins after all. Turns have to beat margin by more than people assume.
But GMROI has no dates in it either. It has an average.
Take one product, two suppliers. 500 units, $15 landed cost, sold at $20 — $7,500 out, $10,000 back, a 25% gross margin either way. Both arrive the same week and sell down at exactly the same rate, in twelve equal weekly instalments. The only thing that differs is when the money left the bank.
| Domestic supplier | Overseas supplier | |
|---|---|---|
| Cash out | $7,500 on 1 March | $2,250 deposit on 1 December, $5,250 balance on 15 January |
| Stock sells | 8 March – 24 May | 8 March – 24 May |
| Gross margin | $2,500 | $2,500 |
| GMROI | Identical | Identical |
| Days from first dollar out to last dollar in | 84 | 174 |
| IRR | 1,013% | 175% |
Same margin, same units, same selling days, same GMROI, and one earns very nearly six times the rate of return of the other. The deposit you wired in December is the entire story, and GMROI cannot see it because a deposit is not inventory yet.
There is a second difference that matters more than it sounds. GMROI is a ratio, so 2.4 doesn’t compare to anything outside inventory. IRR is an annual rate, which means it sits on the same axis as your line of credit, your supplier’s early-payment discount, and a savings account. You can ask whether a purchase order beats leaving the money where it is, and get a number back instead of a feeling.
| Measure | What it sees | What it can't see | Use it for |
|---|---|---|---|
| Margin % | Profit on one sale | Velocity, turns, timing, terms, lead time | Setting a price |
| GMROI | Margin dollars against average inventory at cost — margin and turns together | Payment dates, deposits, lead time; and it isn't comparable to a borrowing rate | Ranking an assortment over a season |
| IRR | Every dated cash flow: deposits, terms, lead time, the actual sell-down | Risk, forecast error, anything you forgot to include; and it flatters short cycles badly | Choosing between purchase orders and suppliers |
None of these replaces the others, and I use all three in a normal week. Margin is a pricing decision. GMROI is how I would grade an assortment at the end of a season. IRR is the one I open when there is one pot of money and three purchase orders that all look reasonable.
Which supplier should get the money?
This is where the great equalizer actually earns the name, and it took me a while to see that suppliers, not products, are the useful unit. Here I am on a call in late July, walking a consultant through it a few days before it shipped:
“If I look at like domestic suppliers, they’re going to have an advantage because like, you know, the money churns quicker… And the eventual goal is, okay, I only have 100k in my bank that I could spend. What should I spend it on? Based on the IRR analysis, like best return rate. And if ones are like below, let’s say 15%, then maybe I shouldn’t, I should drop that supplier because I could just put money in like a high yield or whatever investment vehicle.”
The 15% is the part I’d argue for hardest. Set a hurdle rate — whatever a safe alternative pays you, plus something for the risk and the work — and a supplier whose purchase orders don’t clear it is a supplier you are subsidising. Most operators have never put a number on that, so every purchase order gets compared to zero and they all pass.
Nothing in the examples above would fail a 15% test, and that is because I picked stock that sells. The purchase orders that fail are the ones nobody models: the six-month lead time, the minimum order quantity that buys eleven months of cover, the seasonal line that half-sells and then gets marked down in January. Stretch the cash out far enough and the return collapses toward nothing, and it collapses long before the margin report looks worrying.
This also reframes overseas sourcing. A cheaper unit cost with a 30% deposit ninety days out and a slow boat can lose to a domestic supplier at a worse unit price, and the margin report will never tell you, because on margin the cheap one wins. I am not saying stop importing. I am saying price the ninety days.
Where does IRR lie to you?
Enough that you should not quote it to anyone without a caveat.
It flatters short cycles absurdly. Hold that twelve-week schedule exactly as it is and cut the landed cost from $15 to $12 — a 40% margin instead of 25% — and the domestic option comes out at 8,392%, which is arithmetically correct and completely useless as a number. That happens because IRR annualizes, and it assumes every dollar that comes back gets redeployed instantly at the same rate. You cannot buy stock in eight-hundred-dollar weekly increments the moment cash lands.
There is a standard fix for that, and it is the reason I stopped worrying about the silly percentages. Modified internal rate of return — MIRR — discounts and reinvests at a rate you nominate rather than at the IRR itself. Set that rate to your actual alternative, and the number stops pretending you can redeploy at 8,392%. Our leaderboards compute the plain IRR, the MIRR against your hurdle rate, and the net present value at that same hurdle, side by side, precisely because the raw figure is the least trustworthy of the three.
It is only as good as the cash flows you feed it. Miss the storage fees, the freight, the returns, the chargebacks, and you have computed the IRR of a product that doesn’t exist. Historical IRR also quietly assumes next quarter’s demand looks like last quarter’s, which is the same assumption that makes forecasts wrong. Neither of those is a maths problem and no metric will save you from them.
The two cases that held this up for years were both accounting questions, not finance ones. What is the IRR of a purchase order that is 80% sold through — do you value the remainder and close the cycle, or leave it out? And what do you do when a stock take writes off twelve units, which is not a sale but is certainly a cash outcome? The answers we landed on: value the unsold remainder at cost as a final inflow on the valuation date, with a toggle to exclude any purchase order that isn’t essentially sold through if you only want realised results. And treat bulk stock-take shrinkage as periodic reconciliation rather than a trading loss on whichever purchase order happened to be open, because one big count will otherwise make a genuinely profitable order look like a disaster. The add-back is bounded twice — at the shrinkage actually traced to that order’s own layers, and at the capital still unrecovered on it — which is the mechanism that stops a generous reading of a count from turning a loss into a profit. You can drill into the exact shrinkage events behind any supplier’s number and disagree with the whole idea.
I spent five years not shipping this because I could not answer those two questions honestly, not because XIRR is hard. XIRR is nine lines.
The consultant I mentioned earlier prefers a different tool for the same job, and said so plainly:
“Well, yeah, well, we’re doing cash conversion cycle. Look, if I invest and spend $10,000, how much money is that going to turn into over X time? How’s that compared to the stock market in gold and my other products? Like where should I be putting my money if I already have an engine and I already can do it?”
He is probably right for most operators. Cash conversion cycle gives you a number in days, days are intuitive, and nobody has to be talked out of believing an 8,392% return. I still prefer IRR, for one reason: it prices a single purchase order, and a single purchase order is the decision you actually make. Cash conversion cycle describes the business. IRR describes the thing you are about to click.
Pick whichever one your team will actually keep up to date. Both of them beat ranking by margin percentage, which is what most people do instead.
What do you need to run this yourself?
Four things per product, and none of them are exotic: the date and amount of every payment to the supplier, including deposits; the landed cost, so freight and duty are in the number; the date and amount of every sale; and a decision about where the cycle ends. Put them in a column with dates beside them and use XIRR. That is the whole method, and it works in the spreadsheet you already have.
The reason people don’t do it is that assembling those four columns for 900 SKUs by hand is a week of work that is out of date before you finish it. That part is a software problem, and here is where we honestly are.
The ingredients were the hard part, and we already had them. Inventory sits in a perpetual ledger with FIFO cost layers, so the landed cost of a unit is a specific number attached to a specific receipt rather than a rolling average. Purchase orders record what you agreed to pay and when, and vendor deposits are tracked against the supplier’s bills instead of vanishing into a prepayment account. The demand planning grid already had lead times in it. Dates and costs per unit, in other words, which is all XIRR ever wanted.
Since July 2026 the IRR sits on top of that. A purchase order carries its own return metrics, built from the real dated series: the deposits and bill payments that actually left the bank, a term-derived estimate for a balance you haven’t paid yet, and the proceeds of that order’s units as they sell through their FIFO layers. That last part is the fiddly bit — a unit that got transferred to another warehouse, sent into FBA, or consumed into a kit still gets its eventual sale credited back to the order that paid for it, rather than sitting there looking like stock nobody ever sold. Suppliers and products each get a leaderboard ranked by pooled return with your hurdle rate applied, and any row opens onto the cash flows underneath it.
Alongside the return it shows where the units went — sold here, sold downstream, on hand, in transit, written off — because a return figure you can’t tie back to units is one nobody should act on. That breakdown is also the first place a wrong-looking IRR explains itself.
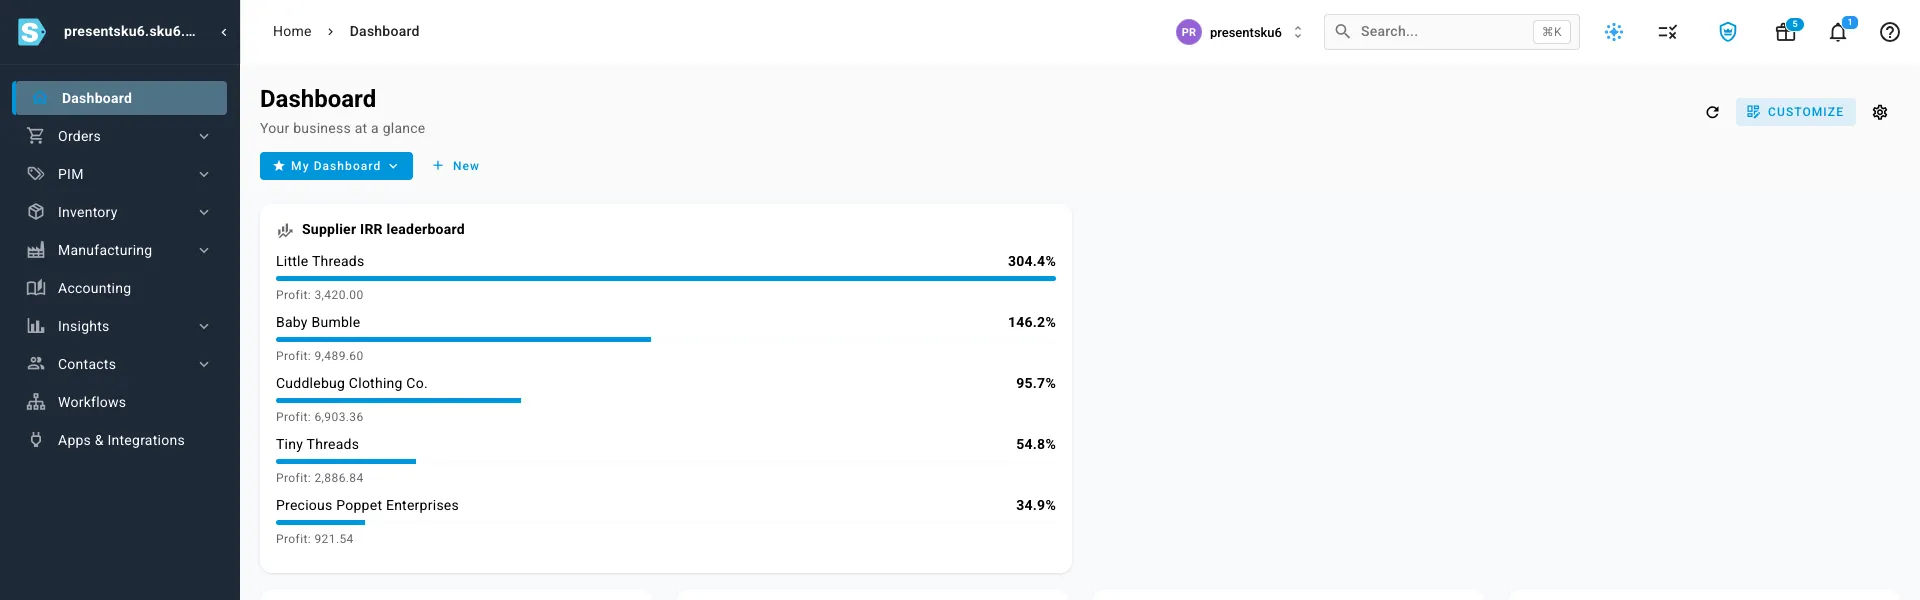
A sample account, ranked by annualized return on the cash each supplier actually consumed. The two in the middle are the argument on this page: Cuddlebug returned a slightly better multiple on the money than Baby Bumble — $6,903 on $10,200 against $9,490 on $14,700 — and still ranks below it, because Cuddlebug’s cash went out months earlier and stayed out. On a margin report they look the same. They are not the same.
What I would still not claim: it does not know your cost of capital unless you tell it, it cannot price risk, and it will not stop you buying something stupid with a good IRR. It ranks where your money has actually gone and what it earned. The deciding is still yours.
Who should ignore this entirely?
If you are under about $1M on a single channel, ignore it. Your constraint is demand, not capital allocation, and time spent on cash-flow modelling is time not spent selling. Come back when you are choosing between purchase orders instead of trying to fill one.
If your margins are wide and your stock turns fast, ignore it too. When everything clears the hurdle by a mile, ranking is a waste of a Sunday.
It earns its keep when capital is genuinely the binding constraint — you have more products worth stocking than money to stock them — and when your suppliers differ in terms and lead times, which for anyone importing is always. That is also the operation where getting it wrong is expensive, because the money is committed months before you find out.
Where to go from here
The number underneath all of this is per-order profit that includes marketplace fees, and it is the one most systems get wrong; true profit versus gross profit covers why. If your accounting software is where you currently go for these answers, why you shouldn’t make decisions in your accounting software explains the mismatch. And if you would rather ask these questions in a terminal than click through a report, running inventory and purchasing with AI agents is how I do it on my own business.
Or bring me a supplier and a purchase order and we will run the calculation on your real numbers, including the ones that make it look bad. Book a demo.