Generate and read a Support Insights report
Video chapters
A Support Insights report shows what your team asks SKU.io Support about, and why. It puts three things side by side: your support tickets, how your team uses each feature, and whether our servers were up. It then leads with a short, ranked list of findings, each marked as something for us to fix, something for your team to act on, or both.
Every report is dated and kept. The same data always produces the same report, because the report is computed by fixed rules from your stored data. No AI writes it.
Before you begin
- You need the Support Insights → Access permission. Admins have it automatically. It isn't part of Full Access, because the report names the team members who raise tickets, so an admin has to turn it on for any other role. See Support Insights permission.
- Support insights uses the tickets your company raises through Support. To raise one, see Get help and track your support tickets.
Generate a report
-
Go to Support → Tickets. At the bottom of the support hub, click See what your tickets add up to — Support insights.
You can also open it from Insights → Reports → Support Insights.
-
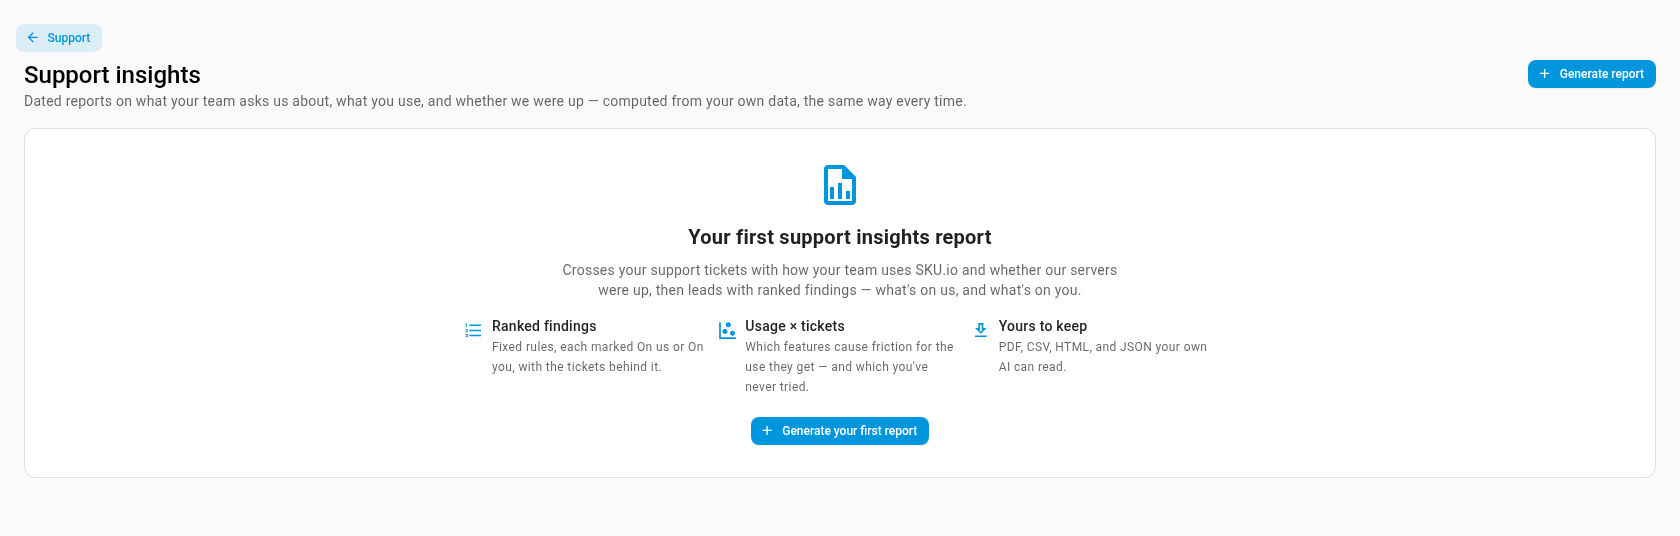
Click Generate your first report (or Generate report once you have one).
-
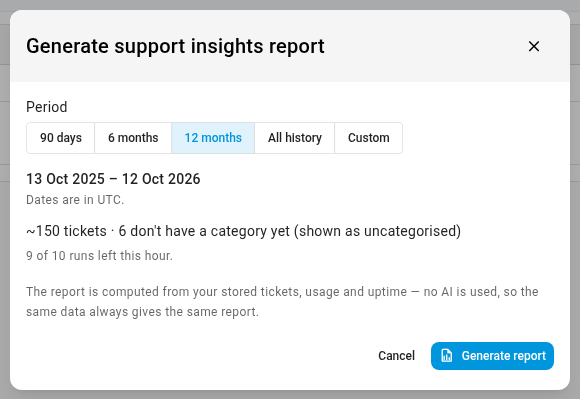
Choose a period: 90 days, 6 months, 12 months, All history, or Custom for your own start and end dates. Twelve months gives the clearest picture of trends.
Under the dates, you can see roughly how many tickets the report covers, how many of them don't have a category yet, and how many runs you have left this hour.
-
Click Generate report.
The report page opens and steps through Collecting support history, Measuring usage & uptime, Computing findings, Checking for internal content, and Rendering files. It usually takes under a minute. You can leave the page while it runs: the job tray in the top bar tracks it, and the page updates by itself when the report is ready.
| Limit | What happens |
|---|---|
| One report at a time | Generate report and Re-run are disabled while a report is being generated. |
| 10 reports an hour | After that, Generate report is disabled until the hour is up. |
| Up to 36 months | A custom period can't be longer than 36 months, end in the future, or start after it ends. |
Read the findings
The report opens with the headline numbers:
| Card | What it shows |
|---|---|
| Tickets | Tickets in the period, with how many are still open and how many are private. |
| First response | Median time to our first reply, in calendar hours and business hours. |
| Resolution | Median time to resolve a ticket, in calendar time and business time. |
| Reopened | The share of tickets that were resolved and then opened again. |
| Confirmed defects | Tickets confirmed as a bug, with suspected ones counted separately. |
| People asking | How many of your team raised tickets. |
| Features never used | Features in your plan that nobody at your company has used. |
Below the cards are the findings, ranked so the most important comes first. Each finding has a type, such as Real pain or Unused capability, and says whose move it is:
| Badge | Meaning |
|---|---|
| On us | Something SKU.io should fix, such as a spike in tickets during measured downtime. |
| On you | Something your team can act on, such as a feature in your plan you've never used. |
| Both | A shared fix, for example clearer product behaviour from us and a settings review from you. |
| No action | Context only, such as a busy week when uptime wasn't being measured yet. |
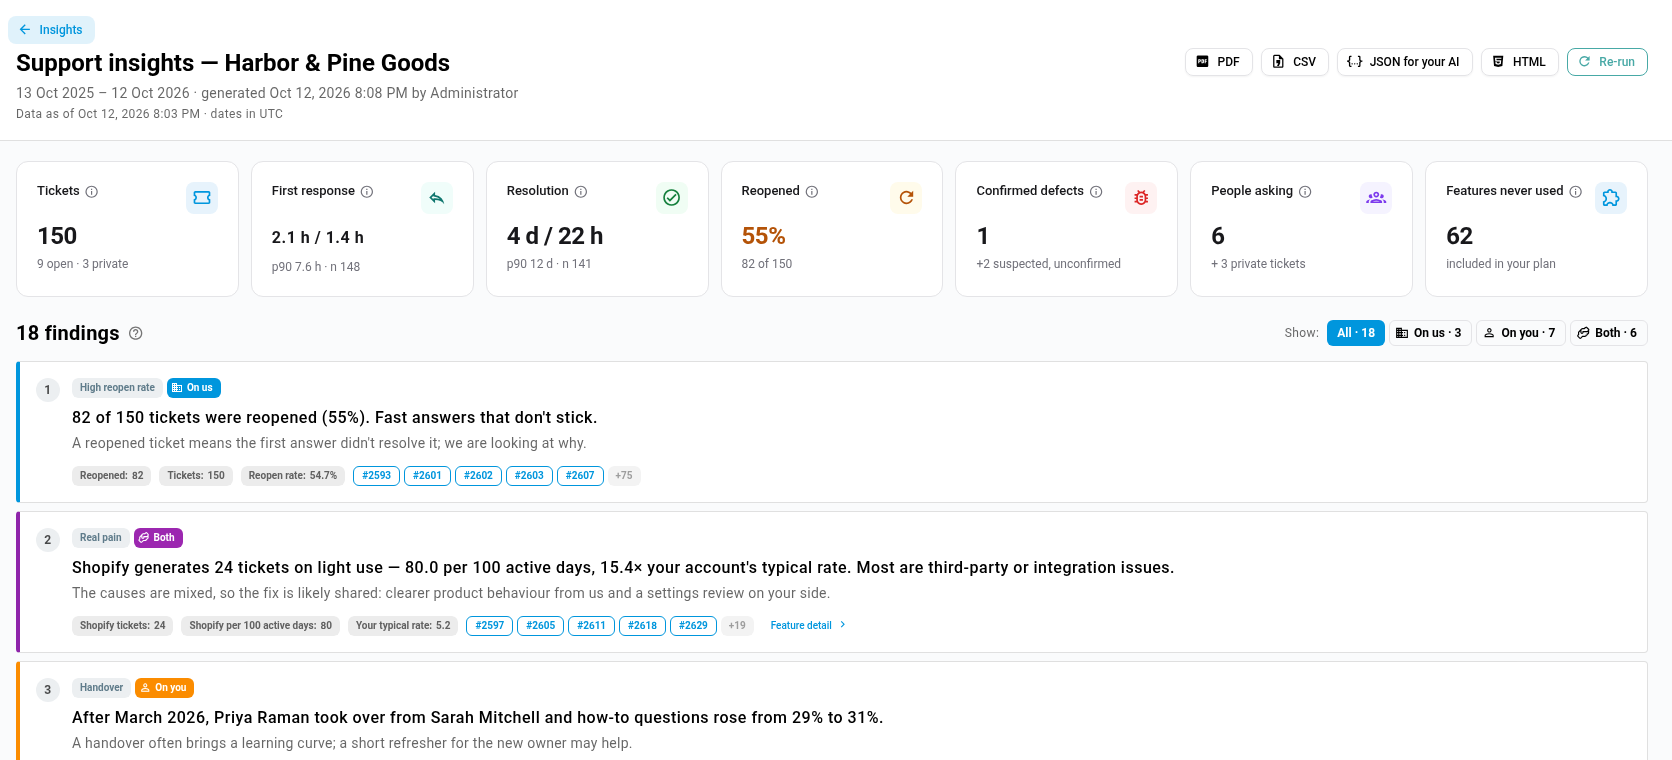
The chips under a finding are the tickets behind it. Click one to open that ticket.
- To see only one kind, use Show above the list: All, On us, On you, or Both.
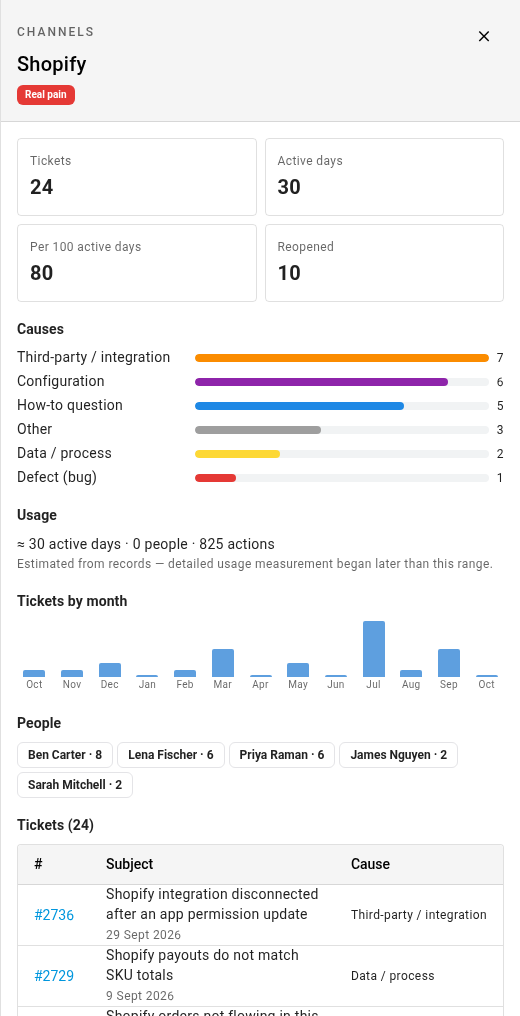
- When a finding names a feature, click Feature detail. A drawer opens with that feature's tickets, their causes, the people who asked, and how much the feature is used.
Explore the sections
Use Contents on the left to jump to a section.
| Section | What it tells you |
|---|---|
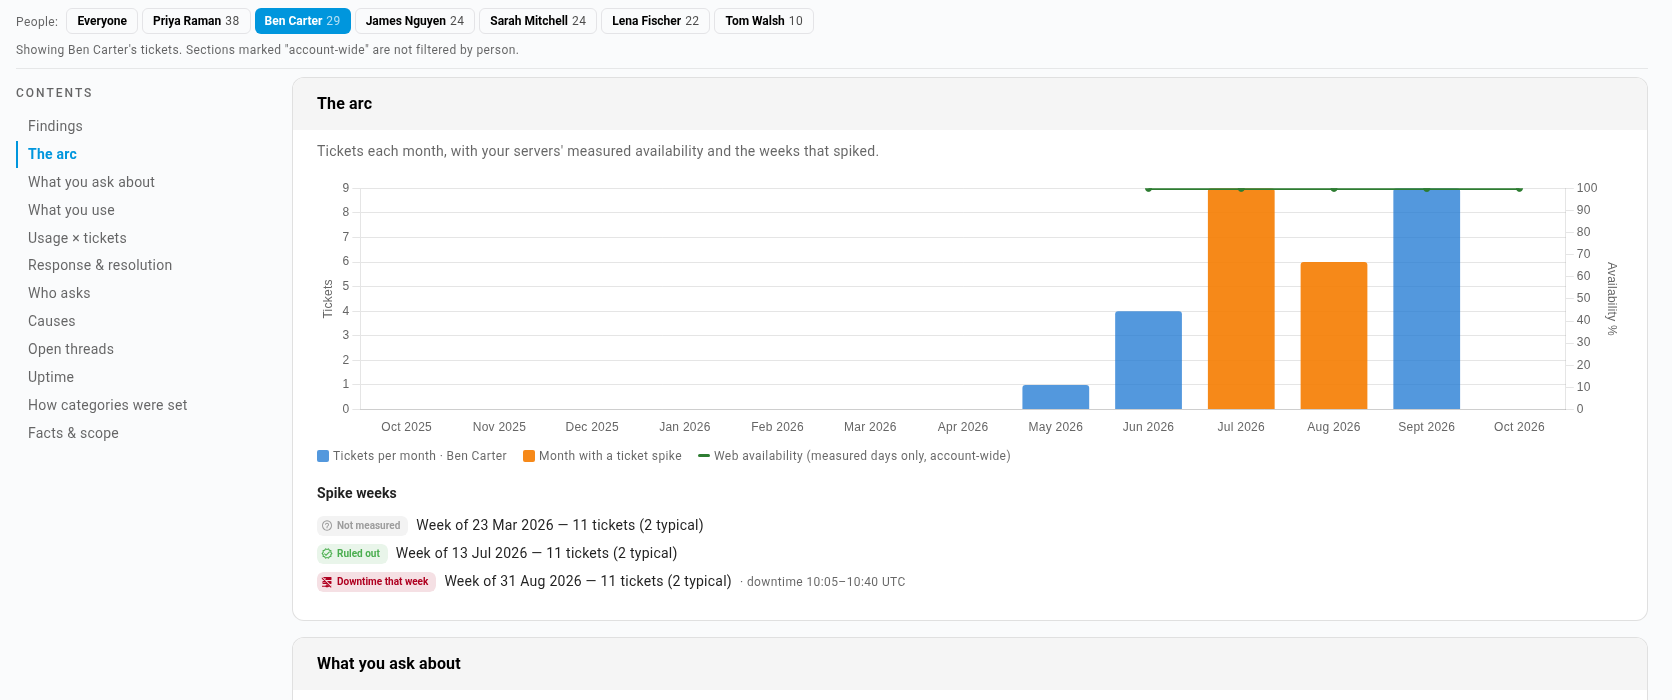
| The arc | Tickets each month, with your servers' measured availability and the weeks that spiked. Each spike week says whether there was measured downtime that week. |
| What you ask about | Tickets grouped by area and feature, with the mix of causes for each feature. |
| What you use | How much each feature was used over the period, including features nobody has used and any you marked Not for us in Feature Adoption. |
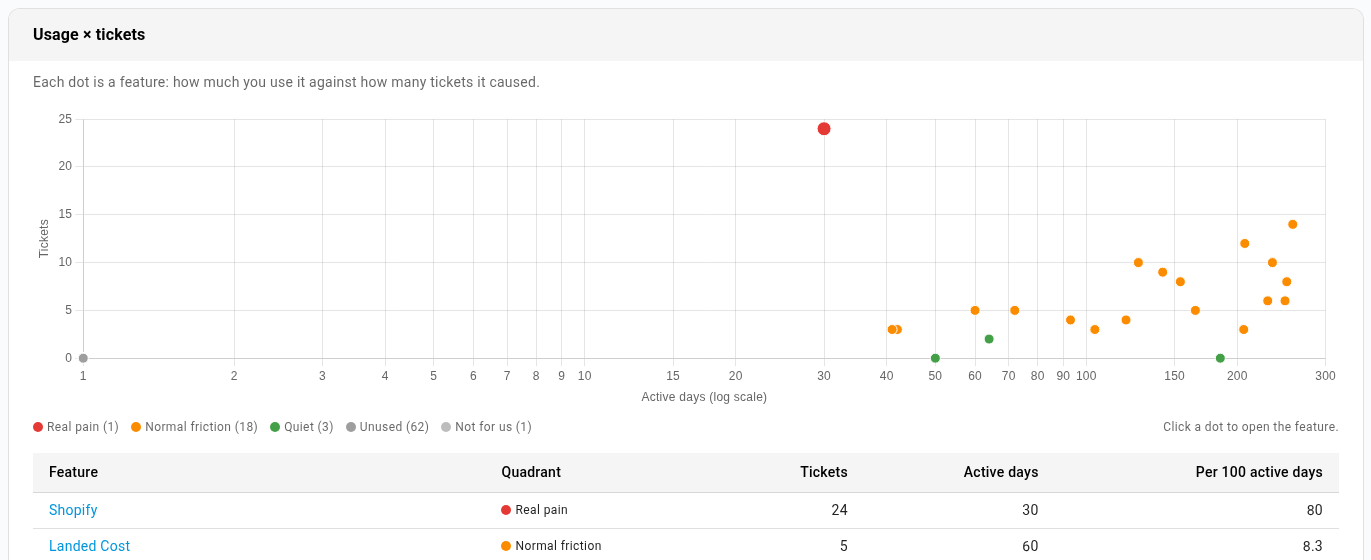
| Usage × tickets | Each feature plotted by use against tickets. Real pain marks a feature with many tickets for little use, Normal friction a busy feature with tickets in proportion, and Quiet a feature that's used but rarely asked about. |
| Response & resolution | Median and slower-case (p90) response and resolution times, in calendar and business hours, plus the reopen rate, how often we met the first-response target, and your ratings. |
| Who asks | Everyone at your company who raised tickets, with their top features, how-to share, and reopen rate. When one person took over from another, it shows here as a handover. |
| Causes | Why tickets were raised: how-to question, configuration, defect, third-party or integration, feature request, billing, data or process, or other. A ticket counts as a defect only when it was confirmed. |
| Open requests & threads | Tickets and feature requests still open at the end of the period. |
| Uptime | Your servers' measured availability against the production median, day by day, with any incidents. |
| How these categories were set | How many tickets were categorised by SKU.io Support, by your team, automatically, or not yet. Click Review … uncategorised tickets (the button shows the count) to list the ones without a category. |
At the end, Verified facts shows how the totals add up, and Scope notes explains what the report can and can't tell you. For example, uptime is a measurement, not a service-level commitment, and weeks before measurement began show as "not measured", not "up".
A ticket marked Only me counts in the totals but is never listed, and nobody is named for it. Who asks shows private tickets only as a count.
Focus on one person
Under People, pick a team member to see the report through their tickets. The ticket sections recount for that person only. The sections that can't be split by person, such as usage and uptime, are marked account-wide · not filtered by person and stay the same. Click Everyone to see the whole team again.
The person you pick stays in the page address, so a link you share opens on the same person.
Download and share a report
The buttons at the top of a report download it:
| Button | What you get |
|---|---|
| The report laid out for printing and sharing. | |
| HTML | The whole report as a single page that opens in any browser, without signing in to SKU.io. |
| CSV | A zip file of the report's tables, ready for a spreadsheet. |
| JSON for your AI | A zip file with the complete report data, a dictionary of every field, and a guide to using it with your own AI tool. |

What's in the CSV download
The zip contains a README.txt and eight files. Dates are local dates in the time zone the
report states.
| File | One row per | Columns |
|---|---|---|
tickets.csv | Ticket in the period (private tickets aren't listed) | id, date, subject, status, type, priority, person, feature_key, feature, area, cause, category_source, suspected_defect, defect, reopened, first_response_h, resolution_h |
monthly.csv | Month | month, tickets, orders |
features.csv | Feature with tickets | feature_key, feature, area, tickets, share, then one column per cause with its ticket count |
causes.csv | Cause | cause, label, tickets, plus a row for suspected defects that aren't confirmed |
usage_matrix.csv | Feature | feature_key, feature, tickets, active_days, rate_per_100_active_days, quadrant |
people.csv | Person who raised tickets | person_key, name, active, tickets, first, last, top_features, how_to_share, reopen_rate, median_resolution_h |
uptime_daily.csv | Day | day, then one column per component (web, app, database, cache) with its availability, or "not measured" |
findings.csv | Finding | rank, rule, severity, owner, headline, detail, feature_key, metric_keys, ticket_ids |
In tickets.csv, category_source says who set the category (ai for automatic, agent
for SKU.io Support, customer for your team). Times ending in _h are in hours.
Use the report with your own AI
JSON for your AI downloads a zip with three files:
pack.jsonholds every number, chart series, and finding, exactly as the report used them.fields.mdexplains what each field means.ask-your-ai.mdis a short guide with the definitions that matter and example questions.
Give the folder to the AI tool your company already uses. SKU.io doesn't send the data anywhere. You can also read reports through the SKU.io API.
Manage your reports
The Support insights page lists every report, newest first, with its period, when and by whom it was generated, its status, and its ticket and finding counts. Use Status and Generated to filter the list. On each row:
- The eye icon opens the report.
- The download icon offers the PDF, CSV, JSON for your AI, and HTML files.
- Re-run with the same dates generates a fresh report for the same period. A report is a snapshot: a re-run picks up anything that changed since, and older reports never change.
- The bin icon deletes the report and its files, after you confirm.
While a report is generating, its row shows Cancel instead.
Correct a ticket's category
Each ticket's category, the feature it's about and the kind of problem, feeds the report. SKU.io suggests a category automatically when a ticket comes in. When one is wrong, fix it:
-
Go to Support → Tickets and open the ticket.
-
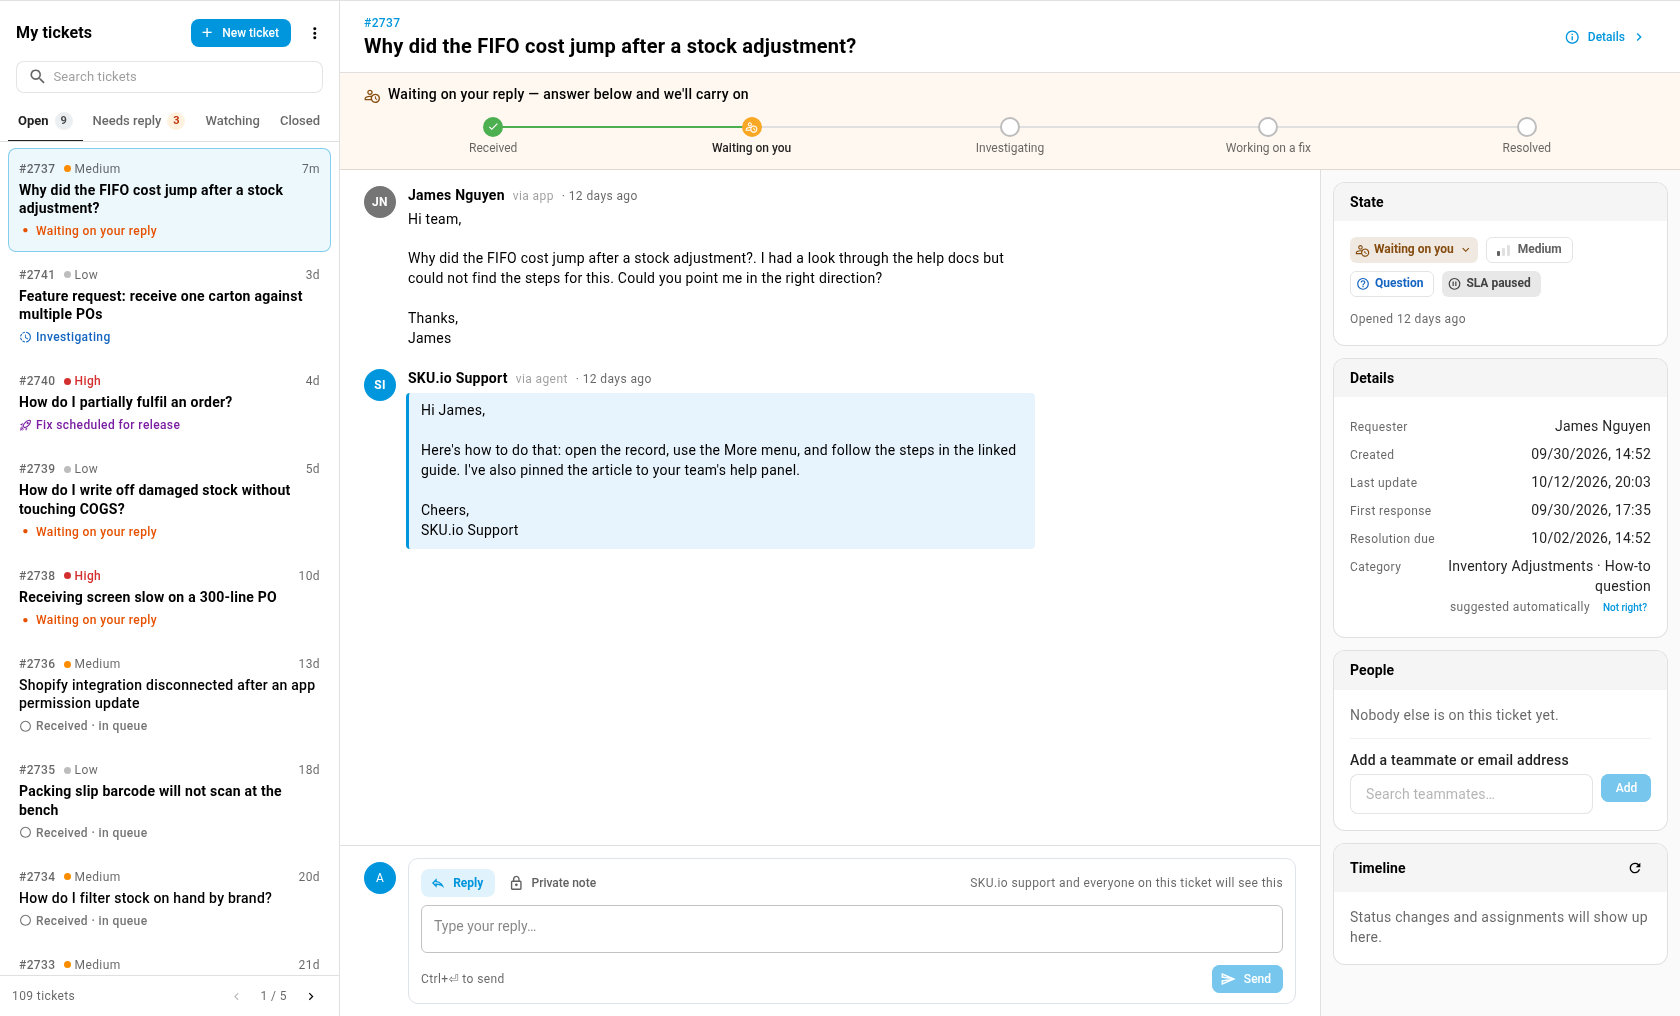
Under Details, find Category. Below it, you can see who set it: suggested automatically, set by you, or set by SKU.io Support.
-
Click Not right?.
-
Choose the Feature the ticket is really about, and What kind of problem it is, then click Save.
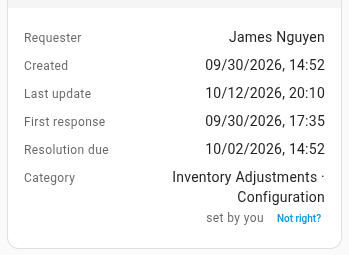
The category now shows set by you, and the ticket's timeline records the change. Your next report uses it. Reports you've already generated stay as they were.
Anyone who can see a ticket can correct its category. Once SKU.io Support sets a category, Not right? is disabled. To change it then, reply on the ticket.
Next steps
Video transcript
Support insights shows what your team asks us about, and why. It crosses your tickets with the features you use, and with our measured uptime. To open it, go to Support in the left-hand menu, then click Tickets to open the support hub. At the bottom of the hub, you'll find a link to your support insights. Click Support insights, and the page that keeps every report you generate opens up.
To start, click Generate your first report, in the middle of the page. Choose a period. Twelve months gives the clearest picture. Under the dates, you can see roughly how many tickets the report covers. Then click Generate report, at the bottom of the dialog. SKU.io starts building it straight away, and the page shows each step as it goes. It usually takes well under a minute, and you can leave the page while it runs. The job tray in the top bar tracks it, and the report opens here by itself when it's ready.
The report opens with the headline numbers. Tickets, response and resolution times, and how many were reopened. Below them are the findings, ranked by how much they matter. A coloured badge on every finding shows who should take action. Each chip under a finding opens one of the tickets behind that finding.
To see only what your team can act on, click On you. These are usually training, settings, or features you haven't tried. When you're done, click All to bring back every finding.
When a finding names a feature, click Feature detail. The drawer shows that feature's tickets, and the causes behind each ticket. It also lists the people who asked, so you know who to talk to. When you've seen enough, click the cross at the top right of the drawer.
The contents list jumps to each section. What you ask about breaks your tickets down by feature and cause. The usage chart plots each feature's use against its tickets. A feature with many tickets but little use marks the real pain point.
To focus on one person, pick them under People. The ticket sections now count only their tickets. Sections marked account-wide stay the same for everyone. To see the whole team again, click Everyone, at the start of the list.
To take the report with you, use the buttons at the top. PDF and HTML are ready to share. CSV gives you every table, ready for a spreadsheet. JSON for your AI is the full data, with a guide for your own AI tool.
Each ticket's category feeds the report, so it's worth keeping it right. To check one, go back to the support hub from the menu. Then open the ticket you want to check, from the list on the left. Its category sits under Details, above a note saying who chose the category.
If the category is wrong, click Not right, just below the category. Choose the feature it's really about, then pick the kind of problem from the list. Click Save, and the category now says set by you. Your next report picks up the change. Earlier reports stay exactly as they were.